
Figures & data
Figure 1. Time-dependent effects of different buffers’ incubation on the endogenous reactive oxygen species (ROS) generation. Sperms were incubated for up to 180 min in capacitating conditions in different buffers. ROS generation was detected by monitoring luminol chemiluminescence during sperm incubation. Results are expressed as moving average of relative luminescence units (RLU)/30 seconds for 2 × 10⁶ sperm. Detection was carried out in triplicate.
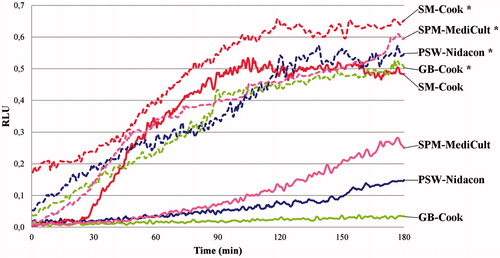
Figure 2. Sperm biochemical parameters observed with different buffers. Sperm, incubated for 180 min in capacitating conditions in different buffers, were analysed for tyrosine-phosphorylation (Tyr-P) pattern, acrosome reaction (AR), and viability (non-viable cells: NVC) by immunofluorescence cytochemistry as described in Materials and Methods. The number of cells expressed as % of the total amount of cells showing Tyr-P in any part of the cell-body, or in the head, were detected and reported as Tyr-P cells and Tyr-P head, respectively. The percentage of cells undergoing AR or NVC were also reported. Spontaneous AR (SAR) percentages were also evaluated in each sample in the absence of A23187 and values reported. **p < 0.0001 and *p < 0.02, comparing each sample against T0 (ANOVA followed by Dunnett’s post hoc test). Values are expressed as the mean ± SD.
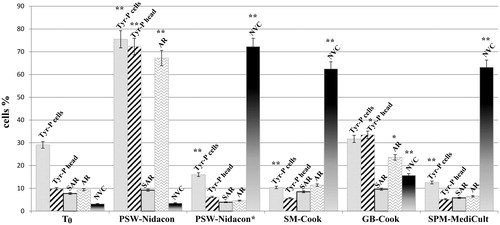
Figure 3. Localization of membrane rafts in human sperm during capacitation with various buffers. Sperms, incubated for up to 180 min in capacitating conditions in different buffers, were analyzed for CTB labeling by immunofluorescence cytochemistry as described in Materials and Methods. (A) T0, control non-capacitated cells; sperm incubated in (B) PSW-Nidacon; (C) PSW-Nidacon* (and representative also of SM-Cook*, GB-Cook*, and GB-Cook*); (D) SM-Cook; (E) GB-Cook; (F) SPM-MediCult; (G) Number of cells expressed as % of the total amount of cells showing CTB labeling in flagellum, head, or both as transient conditions, were detected and reported. †† p < 0.0001 and †p < 0.02, comparing each sample against T0 (ANOVA). Values are expressed as the mean ± SD.
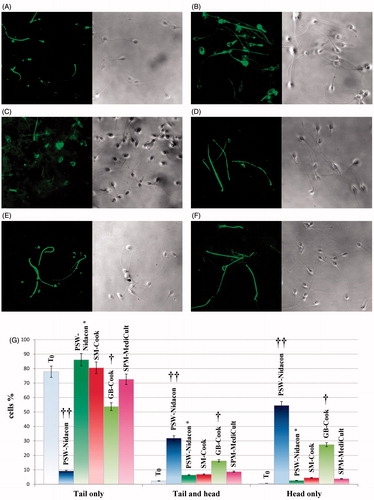
Table 1. Sperm motility and kinematic parameters observed with different buffers.