Figures & data
Figure 1. Light microscopy. Trypan blue treated mice. (A) Control mouse. Some seminiferous tubules with normal appearance are shown. The arrows point to two testicular macrophages. (B) Alcohol treated mouse. The morphology of the seminiferous tubules is severely altered. The tubules show reduced thickness and vacuolization (arrowheads). The arrows point to two testicular macrophages. Scale bars: 50 µm.
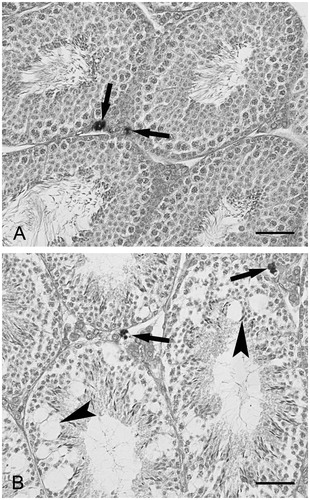
Figure 2. Ultrastructure of interstitial spaces. (A) Control mouse. Several Leydig cells and one testicular macrophage (M) are shown; scale bar: 1.3 µm. (B) Alcohol treated mouse. Several Leydig cells and one testicular macrophage (M) are shown. Two Leydig cell show rarefaction of the cytoplasm (arrows). One Leydig is degenerated (arrowhead). Leukocytes are not present; scale bar: 1.3 µm.
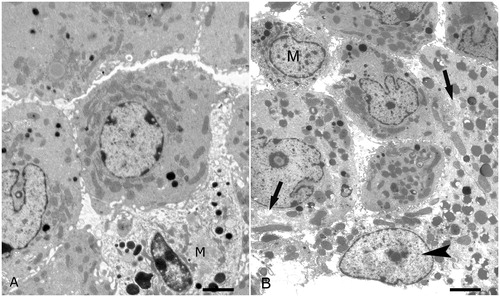
Figure 3. Calprotectin immunohistochemistry. (A) Alcohol treated mouse. Diffuse labeling is present in the interstitial cells (arrows). No labeling is found in the seminiferous tubules; scale bar: 60 µm. (B) Control mouse. Labeling is lacking, both in the seminiferous tubules and the interstitial cells; scale bar: 60 µm.
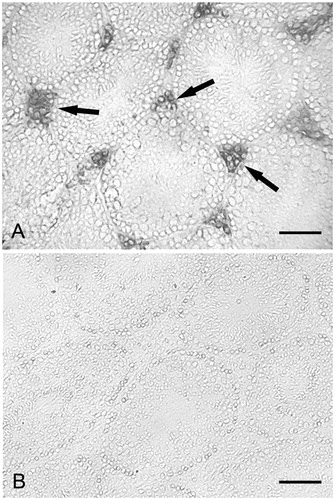
Figure 4. RAGE immunohistochemistry. (A) Small magnification picture. Diffuse labeling is observed in the interstitial cells (arrows). Labeling is also present and basal compartment of the seminiferous tubules (arrowheads); scale bar: 60 µm. (B) Larger magnification of an interstitial space showing a diffuse labeling; scale bar: 25 µm. (C) Larger magnification of seminiferous tubules showing labeled cells in the basal compartment (arrows). No labeling is present in the adluminal compartment; scale bar: 35 µm. (D) Control mouse. Labeling is lacking, both in the seminiferous tubules and interstitial cells; scale bar: 60 µm.
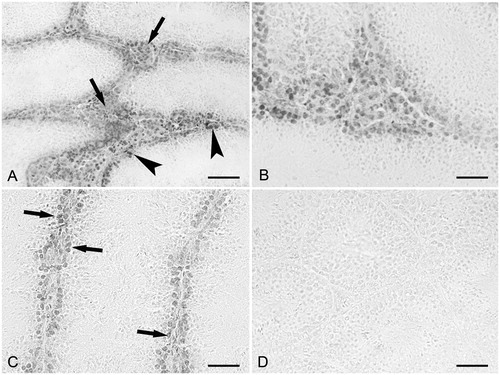
Figure 5. Fluorescent micrographs of mouse testes after staining of free and loosely bound Zn2+ with Zinpyr-1. (A) Control mouse. Intense fluorescence is observed in the seminiferous tubules. Faint fluorescence is present in the interstitial cells (arrows); scale bar: 35 µm. (B) Control mouse. Greater magnification of a seminiferous tubule in transverse section. The fluorescence is evident in the basal (arrows) and adluminal (arrowheads) compartments; scale bar: 18 µm. (C) Control mouse. Late spermatids showing intense fluorescence; scale bar: 15 µm. (D) Alcohol treated mouse. The picture shows some seminiferous tubules characterized by different stages of the seminiferous epithelium. The fluorescence is concentrated in the basal compartment of the seminiferous tubules (arrowhead). Faint fluorescence is present the interstitial cells (arrows); scale bar: 35 µm.
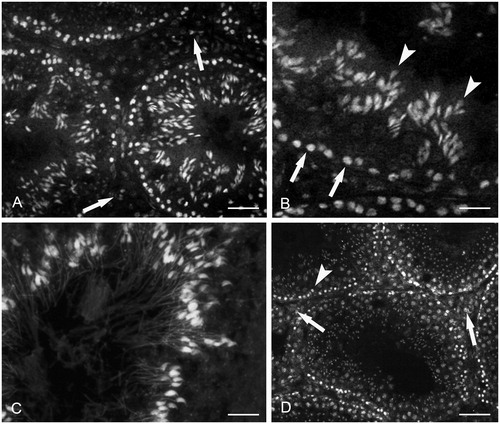
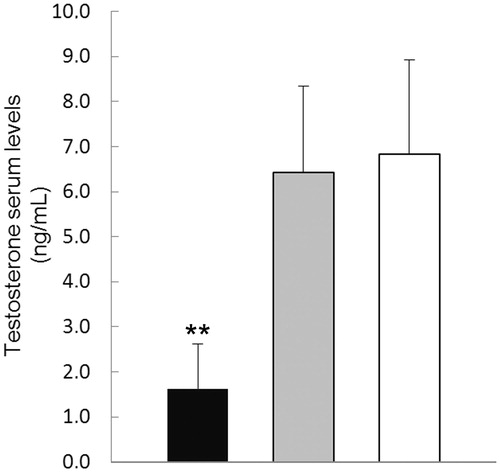
Figure 6. Testosterone plasma levels. Testosterone plasma levels of alcohol-treated mice (black) are significantly decreased when compared with those of maltose dextrins treated mice (gray) and control mice (white). Each bar represents the mean ± SD of fifteen mice. **p < 0.01 versus maltose dextrins treated and control mice.