Figures & data
Figure 1. Expression levels of MTOR mRNA in RSA and control groups. MTOR expression level in blood of patients was significantly lower than the healthy females. The left bar of this figure shows the average MTOR expression level in cases, five heterozygous samples were used. The right bar of the figure shows the average MTOR expression level in control samples, also five heterozygous samples were included. The significance of difference was evaluated by ΔΔCt analysis and student's t test. *p < 0.05 versus wild-type.
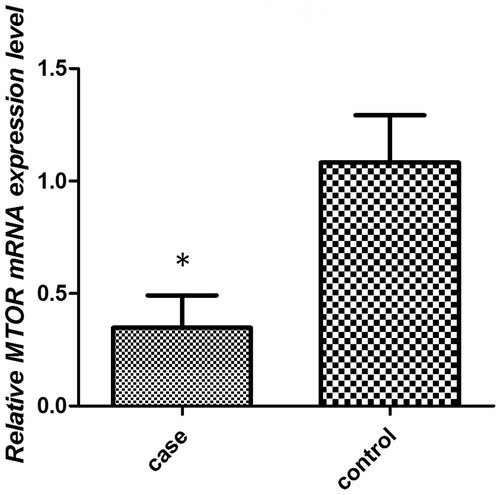
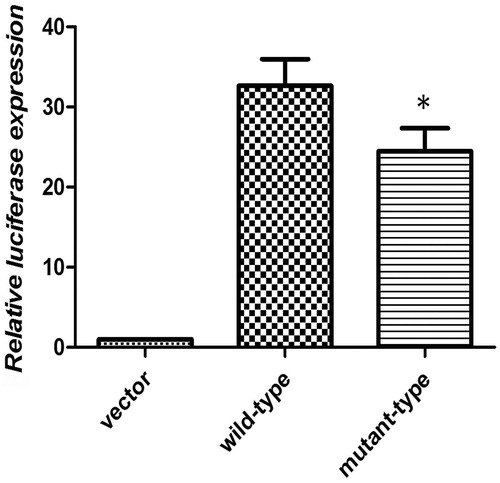
Figure 2. Effect of the MTOR rs17027478 polymorphism on the expression of MTOR. We cotransfected human embryonic kidney 293 cells (HKE-293) with pGL3-Basic vector or pGL3- MTOR reporter construct (wild-type or mutant) together with Renilla luciferase plasmid. The pGL3- MTOR reporter construct contains either the rs17024748 C allele or the A allele. Cell extracts of HKE-293 cells were collected and firefly and Renilla luciferase activities were measured 48 h after transfection. Data represent mean values from at least three independent experiments. The significance of differences was evaluated by the one-way analysis of variance (ANOVA). *p < 0.05 versus wild-type.