Figures & data
Table 1. Clinical characteristics of the study subjects.
Table 2. Analysis of association between TP53 codon 72 polymorphism and the male infertility.
Table 3. Characteristics of case-control studies included in this meta-analysis of TP53 codon 72 polymorphism.
Figure 1. Forest plot of male infertility association with distribution of TP53 codon 72 polymorphism in recessive model. A forest plot of odds ratios (OR) of male infertility for Pro/Pro when compared to Arg carriers in order of publication year was constructed. The squares and horizontal lines correspond to the OR and 95% confidence interval (CI) of each study. The center of each square represents the OR; the horizontal line shows the corresponding 95% CI of the OR. The diamond represents the pooled OR and 95% CI (OR = 0.91; 95% CI: 0.61–1.36). The pooled OR was obtained using a random-effects model and is represented by hollow diamonds, where its center indicates the OR, and its ends correspond to the 95% CI. The area of the squares reflects the relative weight of each study. The weighting factors (weight %) used to calculate the aggregate OR, calculated from the inverse of the variance, is given for each study.
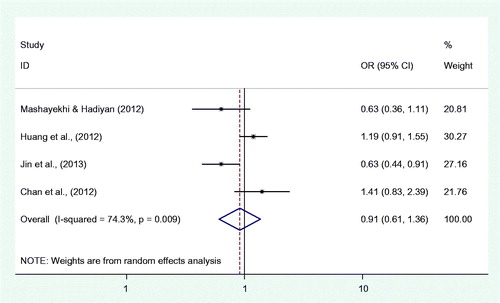
Figure 2. Forest plot of male infertility association with distribution of TP53 codon 72 polymorphism in additive model. A forest plot of odds ratio (OR) of male infertility for Pro allele when compared to Arg allele in order of publication year was constructed. The squares and horizontal lines correspond to the OR and 95% confidence interval (CI) of each study. The center of each square represents the OR; the horizontal line shows the corresponding 95% CI of the OR. The diamond represents the pooled OR and 95% CI (OR = 0.86; 95% CI: 0.64–1.15). The pooled OR was obtained using a random-effects model and is represented by hollow diamonds, where its center indicates the OR, and its ends correspond to the 95% CI. The area of the squares reflects the relative weight of each study. The weighting factors (weight %) used to calculate the aggregate odds ratio, calculated from the inverse of the variance, is given for each study.
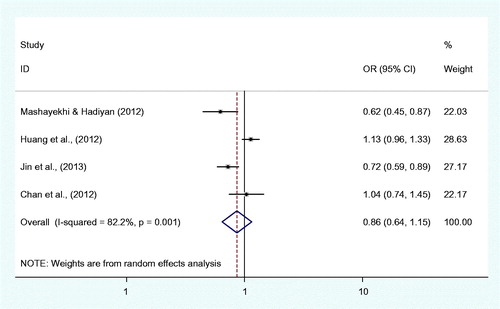
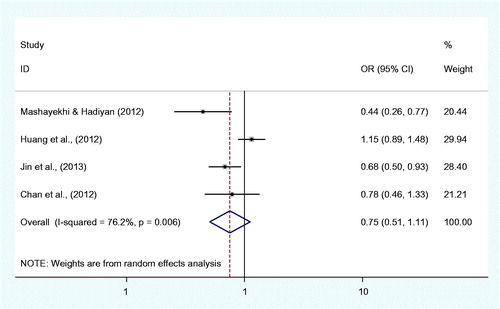
Figure 3. Forest plot of male infertility association with distribution of TP53 codon 72 polymorphism in dominant model. A forest plot of odds ratio (OR) of male infertility for Pro carriers when compared to Arg/Arg in order of publication year was constructed. The squares and horizontal lines correspond to the OR and 95% confidence interval (CI) of each study. The center of each square represents the OR; the horizontal line shows the corresponding 95% CI of the OR. The diamond represents the pooled OR and 95% CI (OR = 0.75; 95% CI: 0.51–1.11). The pooled OR was obtained using a random-effects model and is represented by hollow diamonds, where its center indicates the OR, and its ends correspond to the 95% CI. The area of the squares reflects the relative weight of each study. The weighting factors (weight %) used to calculate the aggregate odds ratio, calculated from the inverse of the variance, is given for each study.