Figures & data
Figure 1. Illustration of the experimental design of the study. (A) Methodology of participant selection. (B) Diagram illustrating the techniques used on each participant’s sperm sample. The eight smokers and the eight non-smokers are identified using letters A to H as indicated in . S: smoker; NS: non-smoker; miRNA: microRNAs; qPCR: quantitative PCR.
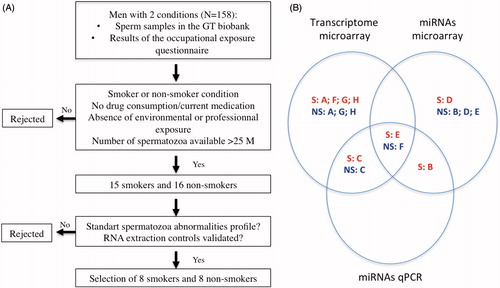
Table 1. Sperm parameters and profiles of smoker and non-smoker patients used for transcriptome study, miRNA chips, and miRNA quantitative PCR.
Table 2. RNA quantity obtained from each sperm sample.
Figure 2. Unsupervised hierarchical clustering of 15 differentially represented transcripts in spermatozoa after p value filtering of t test (p < 0.01) on six smokers and five non-smokers. Smoker samples are identified by the yellow bar and are located on the left of the cluster. Heatmap representation of over represented (red) and under represented (green) genes. The color scale bar indicates Log2 ratio of intensities.
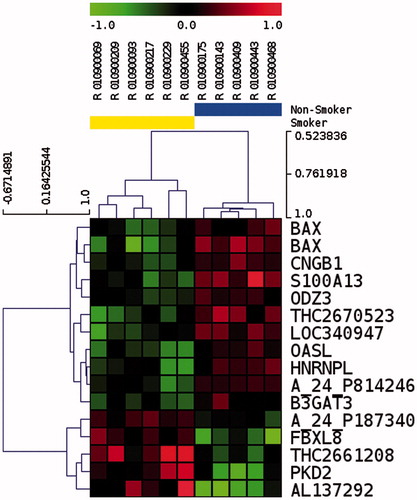
Table 3. List of transcripts with differential level of detection in spermatozoa between smokers and non-smokers after t test (p < 0.01).
Table 4. List of miRNAs present in human spermatozoa with an average level of expression included in the 10% of most represented miRNAs.
Figure 3. Unsupervised hierarchical clustering of 23 differentially represented miRNAs in spermatozoa after p value filtering of t test (p < 0.01) on four smokers and four non-smokers. Smoker samples are identified by the yellow bar and are located on the left of the cluster. Heatmap representation of over represented (red) and under represented (green) genes. The color scale bar indicates Log2 ratio of intensities.
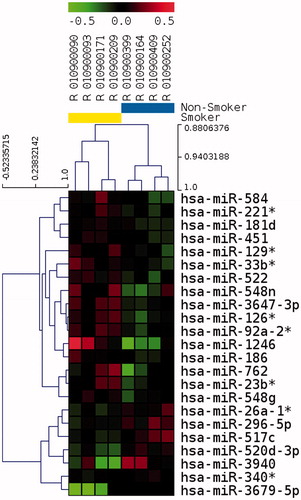
Table 5. List of miRNAs with differential level of detection in spermatozoa between smokers and non-smokers (p < 0.1).
Figure 4. Expression levels of hsa-miR-296-5p, hsa-miR-3940, and hsa-miR-520 d-3p in the spermatozoa of smoking and non-smoking men analysed using quantitative real-time PCR (RT-qPCR). Values represent mean +/- SEM. t test was performed between smokers and non-smokers (*p < 0.01 and **p < 0.001).
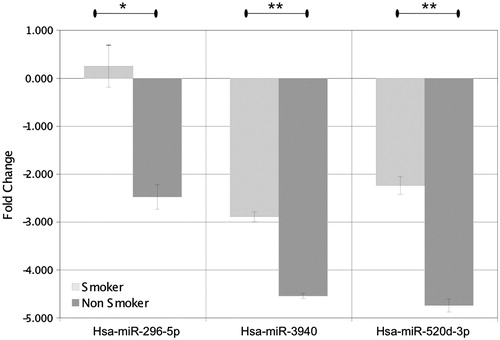
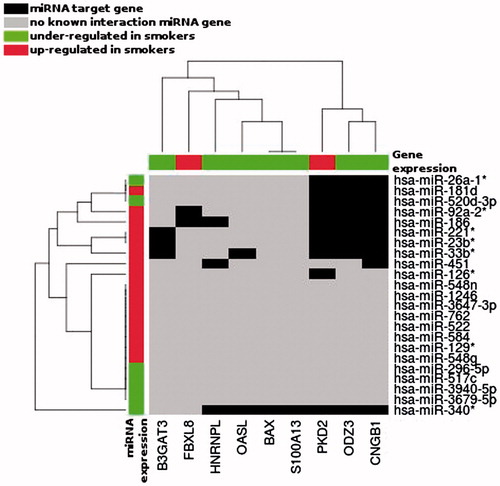
Figure 5. Unsupervised hierarchical clustering of the differentially represented miRNAs (Y axis) and mRNAs (X axis) during spermatogenesis of studied patients, according to the smoking status. Only the miRNAs having target gene, in the TargetScan database v 6.2, corresponding to our 15 differentially represented mRNAs are represented. Black boxes correspond to miRNA target genes; red boxes: gene/miRNA over represented in Smokers; green boxes: gene/miRNA under represented in Smokers.