Figures & data
Figure 1. Percentage of seminiferous tubules with TUNEL-positive cells at different experimental times after a single stressor exposure. Percentages were significantly higher than those observed in control groups from the first hour until reaching a peak 24 hours after acute stress induction. Data shown as Mean ± SEM and subjected to one-way ANOVA and Newman-Keulls analysis. *p < 0.01 vs. control group.
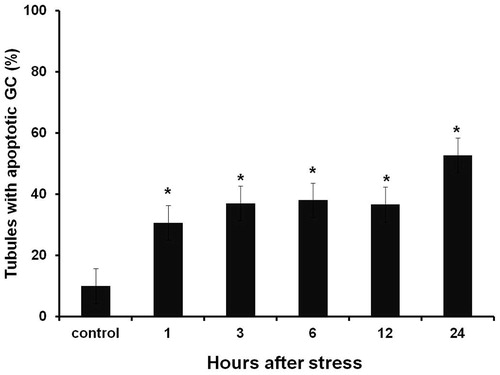
Figure 2. Seminiferous tubules TUNEL-positive cells at 20, 40, and 50 days after chronic stress induction. Percentages were significantly higher than those observed on control groups. Data shown as Mean ± SEM and subjected to one-way ANOVA and Newman-Keulls analysis. *p < 0.01 vs. control group.
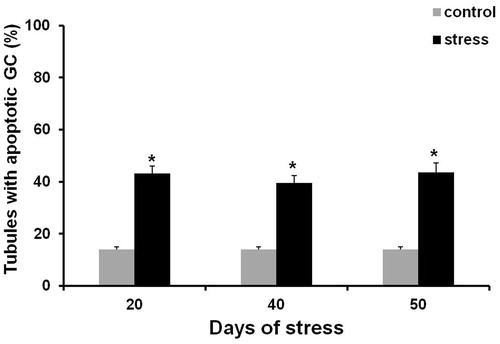
Table 1. Effect of acute stress on body and testes weights of male rats.
Table 2. Effect of chronic stress on body and testes weights of male rats.
Figure 3. Control and stressed rat testicular sections. (A) Control testis showed non-significant TUNEL-positive cells. (B) Seminiferous tubules TUNEL-positive cells increase (arrows) observed only at 1 hour after acute stress induction. (C) Chronic stressed (50 days) seminiferous tubules displayed scattered TUNEL-positive cells. Some apoptotic Leydig cells were also observed (arrowhead). Bar = 50 µm; magnification: 400×.
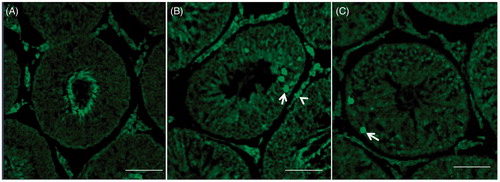
Figure 4. Number of apoptotic germ cells contained in seminiferous tubules in testes of males exposed to acute stress. The number of apoptotic germ cells was significantly higher than in testes of the control group one hour after exposure to the stressor. Data shown as mean ± SEM. One-way ANOVA followed by Newman-Keulls test; *p < 0.01 compared with control.
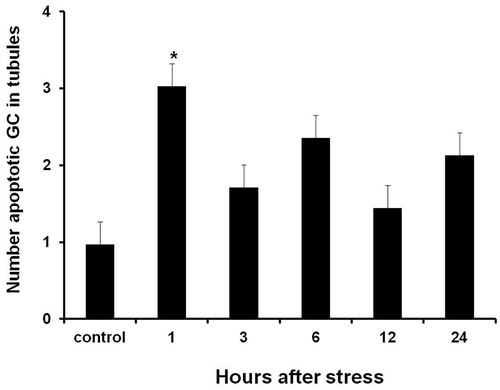
Table 3. Number of apoptotic germ cells (GC) contained in seminiferous tubules (ST) at days 20, 40, and 50 of chronic stress.
Figure 5. Western blot cleaved caspase-8, Bax, Bcl-2, cleaved-caspase-3 proteins detection, and estradiol benzoate (E2) treatment as apoptosis positive control. (A) Active caspase-3 content increased from one until 24 hours after acute stress induction. (B) Cleaved-caspase-8 content increased from one until 24 hours after acute stress induction. (C) Bax content increased from 1, 12, and 24 hours after acute stress induction. (D) Bcl-2 expression decreased at all experimental times. Data is presented as relative protein expression (optical density) normalized β-actin OD quantities from identical blot. (E) Gels from five protein expression analysis for all experimental times. Each data point represents the mean ± SEM; n = 5. *p < 0.05 vs. control groups.
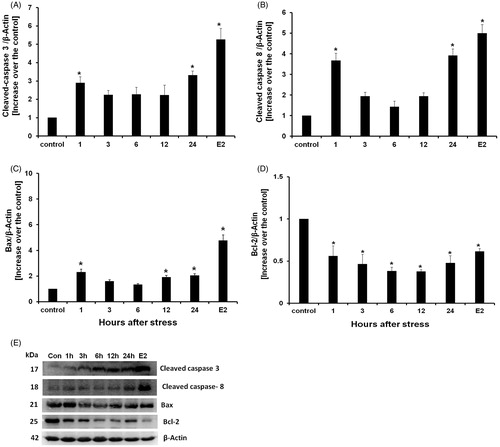
Figure 6. Western blot cleaved caspase-8, Bax, Bcl-2, cleaved-caspase-3 proteins detection, and estradiol benzoate (E2) treatment as apoptosis positive control. (A) Cleaved-caspase-3 content increased at all experimental times. (B) Cleaved-caspase-8 content increased at all experimental times in all days of stress. (C) Bax content also increased during chronic stress at all experimental times. (D) Bcl-2 content decreased in all experimental times. Data is presented as relative protein expression (optical density) normalized with β-actin OD quantities from identical blot. (E) Gels from five protein expression analysis for all experimental times. Each data point represents the mean ± SEM; n = 5. *p < 0.05 vs. control groups.
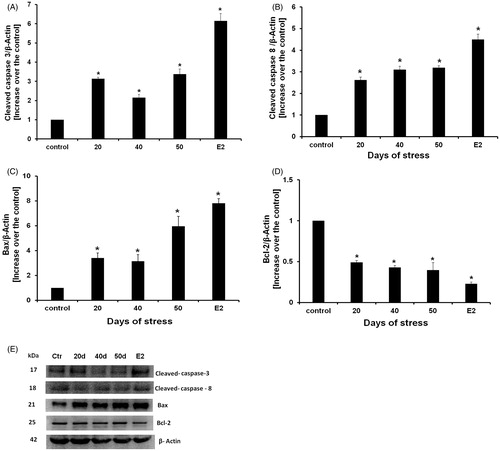
Figure 7. Bax/Bcl-2 relative ratios of acute stress (A) and chronic stress (B). Bax content was significantly increased. Data is presented as Bax and Bcl-2 relative expression. Each data point represents the mean ± SEM; n = 5. *p < 0.05 vs. control groups.
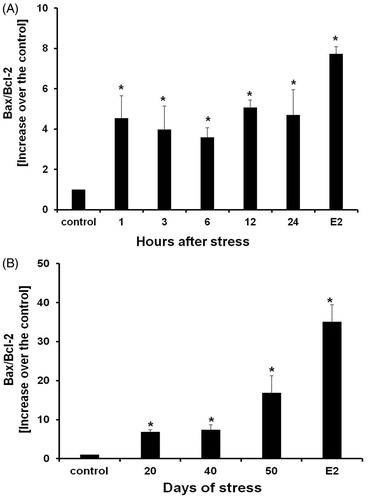
Figure 8. Sperm viability (A), concentration (B), total sperm motility (C), and progressive sperm motility (D). All these parameters appeared lower than when compared to control groups. Data shown as mean ± SEM. Two-way ANOVA and Newman-Keulls analysis; *p < 0.01 vs. control groups.
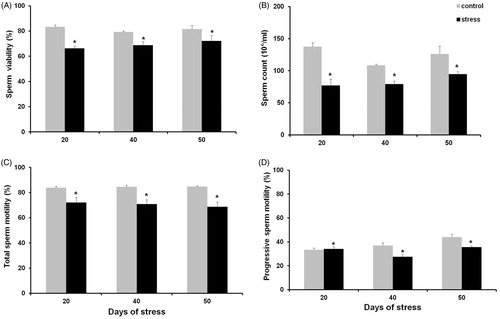
Table 4. Effect of acute stress on viability, concentration, motility, and total and progressive motility of spermatozoa obtained from the cauda epididymis of the rat.
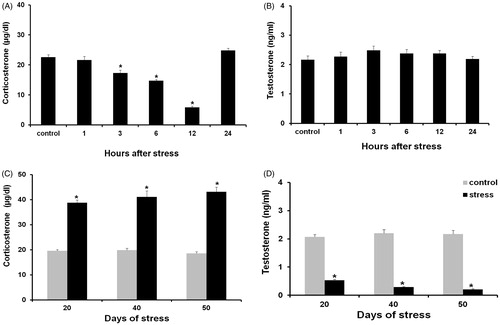
Figure 9. Corticosterone (A) and testosterone levels (B) in males exposed to acute stress. No changes were detected in any of these hormones. (C) Corticosterone levels in males exposed to chronic stress showed a significant increase when compared with the control group. (D) Testosterone levels were significantly lower when compared with the control group. Data shown as mean ± SEM. Two-way ANOVA and Newman-Keulls analysis; *p < 0.01 vs. control groups.