Figures & data
Figure 1. 1H NMR spectrum of human seminal plasma in D2O. This proton spectrum was recorded at 600 MHz and 298 K without TMS as internal standard. The asterisks show signal line width broadening at 7.18, 6.92, 6.89, and 6.75 ppm, assigned to phenylalanine and tyrosine residues linked to macromolecules.
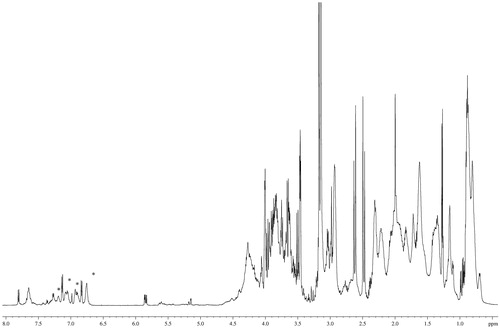
Table 1. Assignments of resonances in proton Nuclear Magnetic Resonance spectrum of human seminal plasma.
Figure 2. Statistical analysis results. Score plot of first principal component (PC1) vs. the second (PC2) illustrating the distribution of the 83 human seminal plasma samples. Samples are indicated by consecutive numbers. The first information arising from this analysis was that sample 54 had a higher value of residual variance with respect to the other samples.
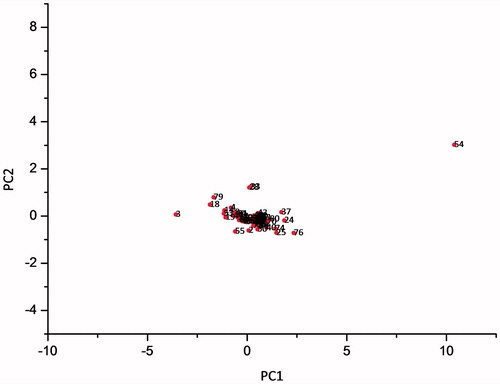
Figure 3. Principal Component Analysis (PCA) results without sample 54. First principal component (PC1) and the second (PC2) scatter plot of all data collected without the sample no. 54 (patient was affected by necrozoospermia). The cluster ellipses were determined according to a cluster analysis. Cluster on the left has been indicated by number 1 while the other one with number 2.
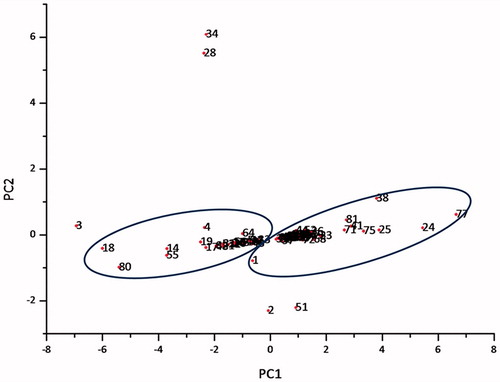
Table 2. Principal components results: eigenvalues and individual variance percent.
Figure 4. Dendrogram representation of the samples data (X-axis: 83 human seminal samples and Y-axis: % of similarity). The resulting clusters were obtained using an unweighted pair group clustering method which calculates Euclidean distance between samples and a standard deviation. Sixty percent of similarity was used as a cut-off value.
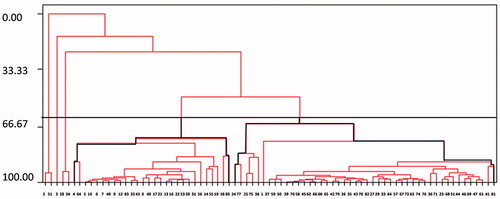
Table 3. Number of patients, age (mean ± standard deviation), country, pathologies, and fertility status of the group of 83 consecutive patients included in the study.
Table 4. The number of patients not showing or showing pathologies such as varicocele, ex varicocele, presence of leukocytospermia, leukocytospermia associated with varicocele, or ex varicocele and the means and standard deviation of seminal parameters from patients included in clusters 1 and 2.
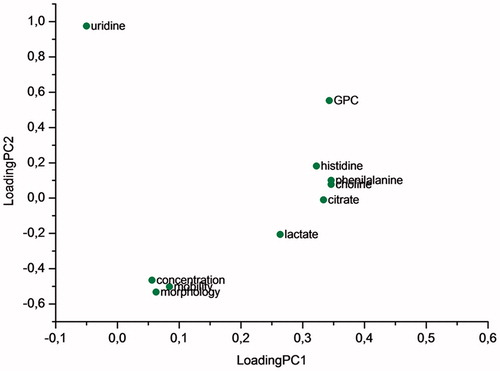
Figure 5. Loading plot of first principal component (PC1) and the second (PC2) variables. The plot suggests which metabolites contribute to the discrimination among samples playing a role in the detection between seminal plasma of unselected patients.