Figures & data
Figure 1. The relation between serum progesterone (P) level on the day of hCG administration and clinical pregnancy rate in each group. The response was considered as a function of the P levels on the day of hCG administration. Samples were divided into the following 8 intervals: ≤1.00, 1.00–1.25, 1.25–1.5, 1.5–1.75, 1.75–2.00, 2.00–2.25, 2.25–2.5, and >2.5 ng/ml. The clinical pregnancy rate in each P interval was calculated to observe the relation between P level and clinical pregnancy rate in these patients. (A) intermediate ovarian response group (Mantel-Haenszel test: χ2 = 74.1721, p < 0.0001); (B) high ovarian response group (Mantel-Haenszel test: χ2 = 16.6985, p < 0.0001); (C) poor ovarian response group (Mantel-Haenszel test: χ2 = 0.1936, p < 0.66).
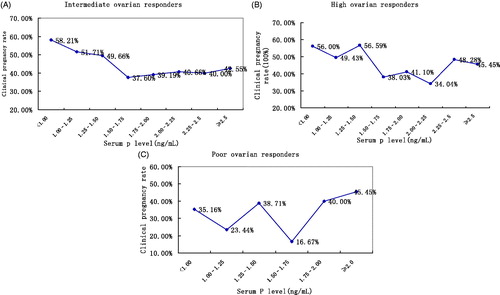
Figure 2. Cut-off values of the level of serum progesterone (P) on the day of hCG administration and duration of elevated pre-hCG P in the intermediate and high ovarian response groups. (A) Cut-off values of serum P level on the day of hCG administration in the intermediate ovarian response group. P levels were divided into the following 8 intervals: ≤1.00, 1.00–1.25, 1.25–1.5, 1.5–1.75, 1.75–2.00, 2.00–2.25, 2.25–2.5, and >2.5 ng/ml according to the level of P on the day of hCG administration. *p < 0.05 for comparison with preceding progesterone level interval; data are expressed as OR (95% CI) for each of the serum progesterone levels compared with the preceding progesterone group (<1.0 ng/ml). (B) Cut-off values of serum P level on the day of hCG administration in high ovarian response group. Response of the patients on the basis of the level of P on the day of hCG administration were divided into the following 8 intervals: ≤1.00, 1.00–1.25, 1.25–1.5, 1.5–1.75, 1.75–2.00, 2.00–2.25, 2.25–2.5, and >2.5 ng/ml. *p < 0.05 for comparison with preceding progesterone level interval; data are expressed as OR (95% CI) for each of the serum progesterone levels compared with the preceding progesterone group (<1.0 ng/ml). (C) Cut-off value of duration of pre-hCG P elevation in intermediate ovarian response group. According to different duration of elevated pre-hCG P, the following 5 intervals: 0, 1, 2, 3, and ≥4-day groups in these patients were considered. *p < 0.05 for comparison with preceding duration of pre hCG P rise interval; data are expressed as OR (95% CI) for each of the pre-hCG P elevation rise duration compared with the preceding duration of pre hCG P rise group (0 day). (D) Cut-off value of duration of pre-hCG P elevation in high ovarian response group. Patients were divided according to the duration of elevation of pre-hCG P; the durations of pre-hCG P elevation are divided into the following 5 intervals: 0, 1, 2, 3, and ≥4-day groups in these patients. *p < 0.05 for comparison with preceding duration of pre hCG P rise interval; data are expressed as OR (95% CI) for each of the pre-hCG P elevation rise duration compared with the preceding duration of pre -hCG P rise group (0 day). hCG: chorionic gonadotropin; on the day of hCG administration: the day of human chorionic gonadotropin administration; P: progesterone; OR:odds ratio; CI: confidence interval.
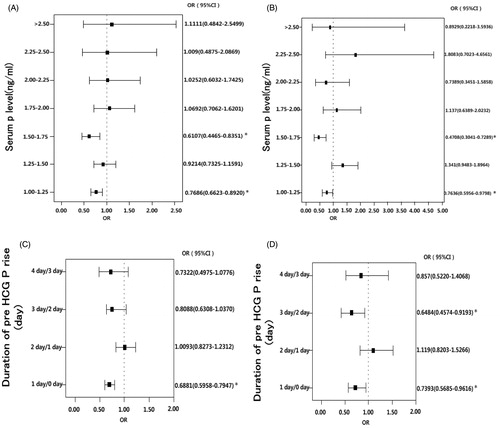
Table 1. General data of the 8575 patients undergoing their first IVF/ICSI cycle.
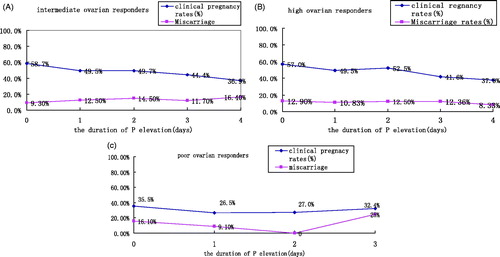
Figure 3. The relationship of duration of elevated pre-hCG P with the clinical pregnancy rate and miscarriage rate in each group. According to different durations of pre-hCG P elevation, the durations of pre-hCG P elevation are divided into the following 5 intervals: 0, 1, 2, 3, and ≥4-day groups in these patients. The clinical pregnancy rate and miscarriage rate in each pre-hCG P elevation group is calculated to observe the relation between duration of pre-hCG P elevation and clinical pregnancy rate in these patients. (A) intermediate ovarian response group (Clinical pregnancy rate: χ2 = 70.4634, p < 0.0001; miscarriage rate: χ2 = 13.237, p = 0.011); (B) high ovarian response group (Clinical pregnancy rate: χ2 = 21.4188, p < 0.0001; miscarriage rate: χ2 = 0.779, p = 0.943); (C) poor ovarian response group (Clinical pregnancy rate: χ2 = 1.7379, p = 0.1874; miscarriage rate: χ2 = 2.926, p = 0.373). hCG: human chorionic gonadotropin; P: progesterone.