Figures & data
Table 1. Differentially expressed proteins identified by MALDI-TOF/TOF MS.
Table 2. PANTHER GO classification of differentially expressed proteins.
Figure 1. Two dimensional patterns of proteins from primordial follicles isolated from immature (A) and aged (B) rat ovaries. Proteins were separated in the first dimension on an IPG strip pH 3–10 and in the second dimension on a 10% acrylamide SDS-gel, followed by staining with coomassie stain. An equal quantity (250 µg) of total protein extracts was loaded in each gel. The gels were scanned and the images were analyzed using Dymension 2D gel image analysis software (Syngene, Cambridge, UK). The distribution of 13 differentially expressed spots is numbered and correspond to .
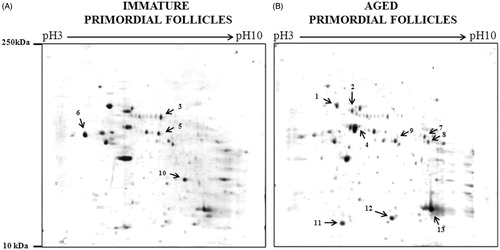
Figure 2. Cropped and enlarged images of 2D gels showing differentially expressed protein spots and graph showing the expression of differentially expressed protein spots. (A) Cropped and enlarged images of 2D gels showing differentially expressed spots. (B) Graph showing the expression of differentially expressed protein spots. Expression is displayed as the average normalized spot volume ratio. The normalized spot volume represents the relative abundance of protein within a spot; the ratio of normalized spot volumes between corresponding spots in a gel equates to changes in abundance of protein within that spot.
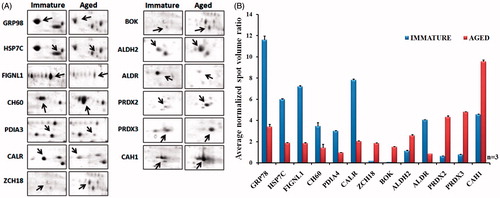
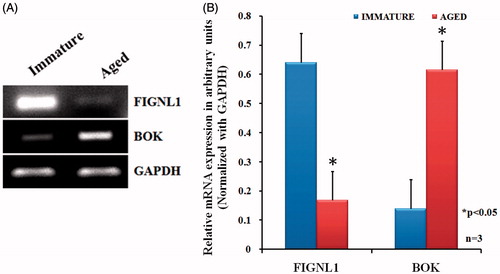
Figure 3. Semi-quantitative RT-PCR for FIGNL1 and BOK. Total RNA isolated from immature and aged rat primordial follicles, reverse transcribed, and the complementary DNA subjected to semi-quantitative RT-PCR in a linear range of amplification with GAPDH as an internal control. Representative image of three independent experiments are shown in Panel A. A graphical representation of results is presented in Panel B. Data from three independent experiments were expressed as arbitrary densitometric units (mean ± SEM). *p < 0.05 compared with immature rat primordial follicles.