Figures & data
Figure 1. Grouping of bulls was carried out based on conception rate. In (A), the conception rate for each bull in the semen bank was calculated from approximately 1,500 inseminations per bull. Bulls were grouped as high fertile (n = 6) and low fertile (n = 6) based on bull fertility index calculated using the average conception rate of their contemporary bulls (n = 20) in the semen bank. In (B), the conception rate significantly (p < 0.001) differed between high and low fertile groups.
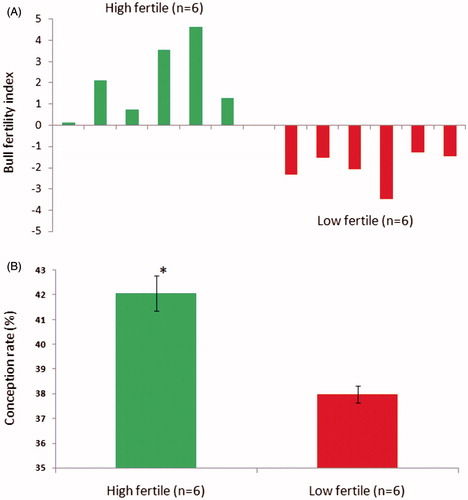
Table 1. Sperm kinetic parameters, plasmalemma integrity, mitochondria membrane potential, and chromatin distribution in high and low fertile bull frozen thawed semen.
Figure 2. Sperm protein profile between high and low fertile bulls was analyzed in Dymension 2 software (Syngene, UK). In Panel A, the protein profile matching protocol was followed as per the recommended guidelines. In Panel B, the combined image was generated to analyze the protein spots matching between fertility groups and sample alignment was confirmed with 3D profile matching. The target protein spot abundance was analyzed by matched spot plot to obtain its protein abundance in high and low fertile groups.
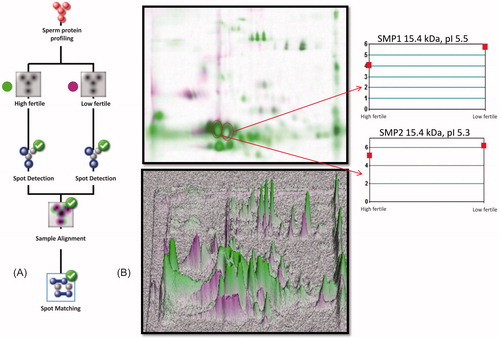
Figure 3. 2DE-protein mapping of spermatozoa showing differential expression profile between high and low fertile groups. (A) Different pH gradients were analyzed (pH 3.1–5.6, 5.7–7.8 and 7.9–10.0), proteins areas under pH 5.7–7.8 was less varied compared to other pH gradients. (B) Spermatozoa proteomic distribution as per pI nature of proteins.
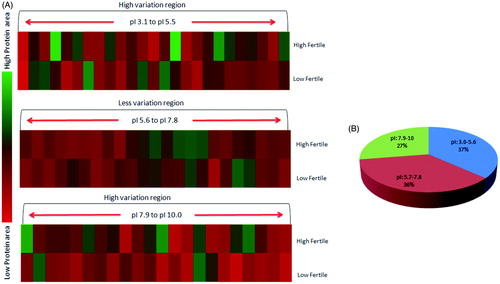
Figure 4. Identification of 2DE protein spot by MALDI-TOF and corresponding spectra of proteins. In (A), protein spots SMP1, SMP2, and SMP3 were identified as major spots and excised from the gel for MALDI-TOF experiment. In (B-D), respective MALDI spectra and inserted bar graph indicating the peptide mass fingerprints of SMP1, SMP2, and SMP3 obtained in Mascot database search.
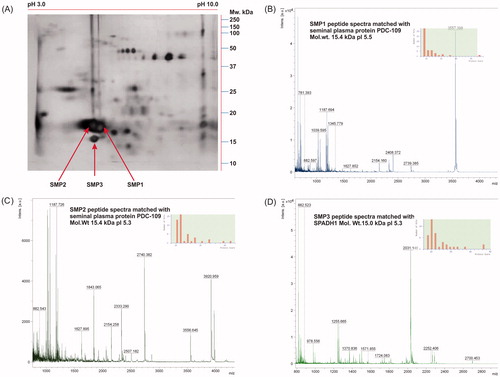
Figure 5. In (A) and (B), 2DE analysis of SMP1 and SMP2 (15.4 kDa) protein spots with pI 5.5 and 5.3. The expression levels were significantly higher in low fertile group when compared to high fertile group. (C) An immunocomplex formation of PDC-109 (BSPH1) antibodies with SMP1 and SMP2 was confirmed by 2DE followed by western blot analysis. (D) Relative expression by western blot analysis of PDC-109 differed significantly (p < 0.05) between fertility groups.
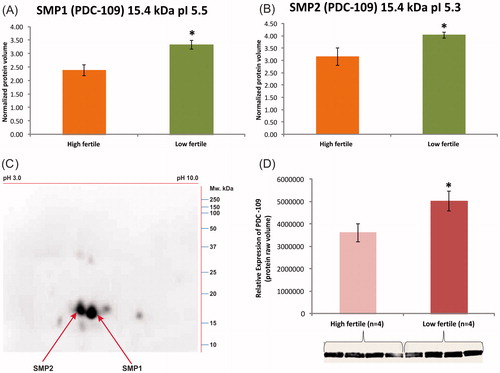
Table 2. Identification of the most abundant spermatozoa proteins by MALDI-TOF and the Mascot score, sequence coverage, and unique peptide reads obtained using Mascot online search engine (Swiss-Prot database) using peptide mass finger print online tool.
Figure 6. (A) PDC-109 interactions were analyzed in STRING online software using organism, Bos taurus. The PDC-109 is identified as a core for eight major proteins (NPC2, ACR, PH-20, ZPBP, SPINK6, Apo-AI, CatSper3, and PB1) involved in different molecular functions (B), biological process (C), and protein class (D) analyzed in PANTHER classification system. (STRING Access Date: 06.07.2014, Time: 2.21 pm; PANTHER Access Data: 20.06.2015, Time: 11.00 am).
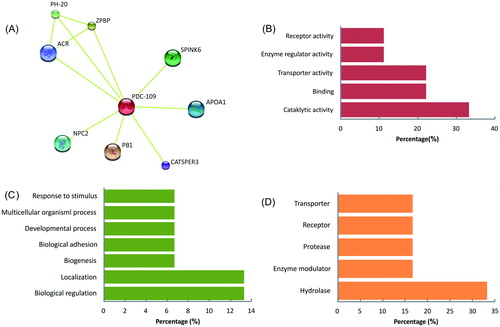
Table 3. The gene annotations of PDC-109 and its interacting proteins studied using DAVID Bioinformatics Resources 6.7 (online bioinformatic database) in specific to Bos taurus genome.
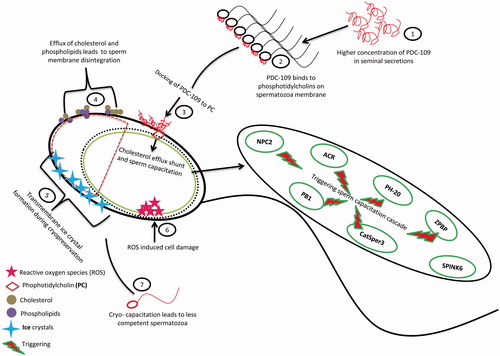
Figure 7. Predictive pathway of PDC-109 induced premature sperm capacitation and cryo-capacitation by triggering sperm capacitation cascade.