Figures & data
Figure 1. Schematic diagram of the X chromosome showing ovarian function as a function of non-mosaic terminal deletions. There are a large number of phenotypic conditions that have been associated with the deleted/duplicated/inactivate or mutated regions on the X chromosome. The terminal X chromosome deletions are often associated with functional ovarian phenotypes and proximal Xq (such as Xq13) deletions often result in absent breast development, primary amenorrhea, and gonadal failure. Therefore, the non-classical form of Turner syndrome, which is called variant Turner syndrome, shows a highly variable phenotype due to the genotypic background of the patients. (a): the region of the marker chromosome [Simpson and Rajkovic Citation1999]. The schematic demonstration of the marker chromosome gene continent, which contained the Xq11.2q13.2 region with the androgen receptor and the X-inactive specific transcript genes and with a deletion of the region distal to Xq13.2.
![Figure 1. Schematic diagram of the X chromosome showing ovarian function as a function of non-mosaic terminal deletions. There are a large number of phenotypic conditions that have been associated with the deleted/duplicated/inactivate or mutated regions on the X chromosome. The terminal X chromosome deletions are often associated with functional ovarian phenotypes and proximal Xq (such as Xq13) deletions often result in absent breast development, primary amenorrhea, and gonadal failure. Therefore, the non-classical form of Turner syndrome, which is called variant Turner syndrome, shows a highly variable phenotype due to the genotypic background of the patients. (a): the region of the marker chromosome [Simpson and Rajkovic Citation1999]. The schematic demonstration of the marker chromosome gene continent, which contained the Xq11.2q13.2 region with the androgen receptor and the X-inactive specific transcript genes and with a deletion of the region distal to Xq13.2.](/cms/asset/6606d820-ebcb-4815-9fe6-5dd277024976/iaan_a_1109007_f0001_c.jpg)
Figure 2. G-band chromosomal analysis of peripheral blood lymphocytes revealed 45,X/46,X,+mar and 45,X. (A) G-band chromosomal analysis of peripheral blood lymphocytes revealed 45,X/46,X,+mar. A GTL banded karyotype of the patient showing an 45,X cell line. All autosomes appear normal in their banding patterns. (B) G-band chromosomal analysis of peripheral blood lymphocytes revealed 45,X. A GTL banded karyotype of the patient showing an 46,X,+marker. All autosomes appear normal in their banding patterns.
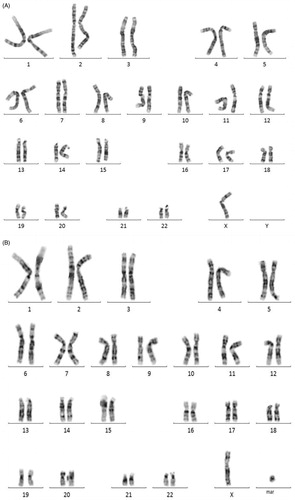
Figure 3. Multicolor FISH (M-FISH) analysis showing a marker chromosome is derived from the chromosome X. M-FISH preparation of a karyotype showing the normal X-chromosome and the marker chromosome which was derived from the X chromosome.
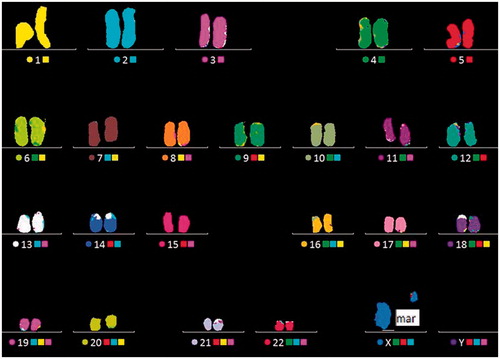
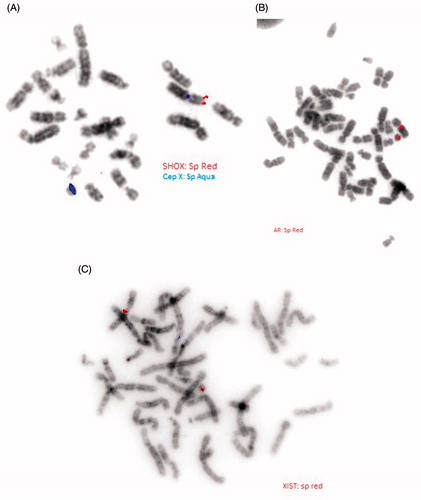
Figure 4. Fluorescence in situ hybridization (FISH) image of metaphase spread using a short stature homeobox (SHOX), androgen receptor (AR), and X-inactive specific transcript (XIST) probes. (A) FISH image of metaphase spread using a SHOX probe. Dual color FISH with the SHOX gene specific probes showing the normal X chromosome and the marker chromosome. The X chromosome centromere probe (Spectrum Aqua; sp aqua; DXZ1) on an inverted grey scale DAPI-stained metaphase spread shows hybridization to both the X chromosome and the marker chromosome. SHOX region (Spectrum Red; sp red) probe on an inverted grey scale DAPI-stained metaphase spread shows hybridization to the X chromosome and deleted in the marker chromosome. (B) FISH image of metaphase spread using an AR probe. Locus specific FISH with the AR gene specific probes showing the normal X chromosome and the marker chromosome. The AR probe (sp red) on an inverted grey scale DAPI-stained metaphase spread shows hybridization to both the X chromosome and the marker chromosome. (C) FISH image of metaphase spread using an XIST probe. Locus-specific FISH with the XIST gene specific probes showing the normal X chromosome and the marker chromosome. The XIST probe (sp red) on an inverted grey scale DAPI-stained metaphase spread shows hybridization to both the X chromosome and the marker chromosome.