Figures & data
Figure 1. Expression of uterine Ca isoenzymes mRNAs in uterus. y-axis represents mRNA fold changes which were measured relative to control and calculated with the 2−ΔΔCT method. x-axis represents different Ca isoenzymes mRNAs. Highest CaII, III, XII, and XIII levels were observed in progesterone-treated rats while highest CaIX levels were observed in estrogen-treated rats. All data were expressed as mean ± SEM from six independent observations. *p < 0.05 as compared to C, †p < 0.05 as compared to E + V. C: control, P: progesterone, E: estrogen, V: vehicle (control).
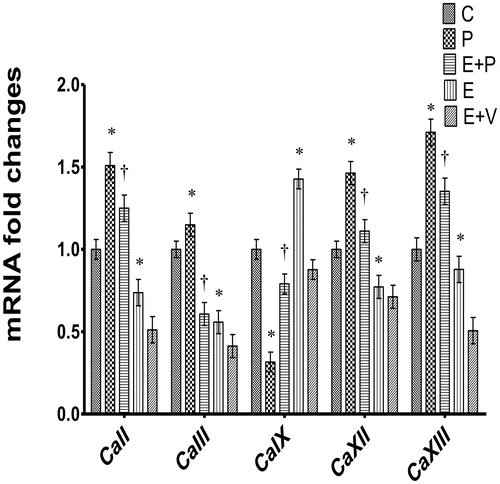
Figure 2. Expression of uterine CA isoenzymes protein in uterus. Representative Western blot images of CA protein bands and the related bar graph showing ratio of CA isoenzymes proteins over β-actin. y-axis represents ratio of the intensity of CA isoenzymes protein bands over the intensity of β-actin protein bands while x-axis represents different CA isoenzymes proteins. The ratio for CA II, III, XII, and XIII over β-actin were highest in progesterone-treated rats while the ratio for CA IX over β-actin was highest in estrogen-treated rats. All data were expressed as mean ± SEM from four independent observations. *p < 0.05 compared to C, †p < 0.05 compared to E + V. C: control, P: progesterone, E: estrogen, V: vehicle (control). Molecular weight for CAII, III, IX, XII, and XIII are 29 kDa, 28 kDa, 58 kDa, 43 kDa, and 30 kDa, respectively.
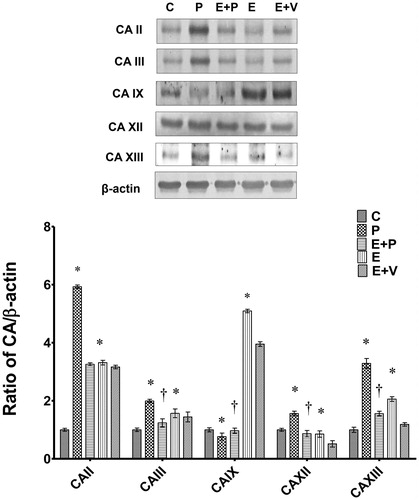
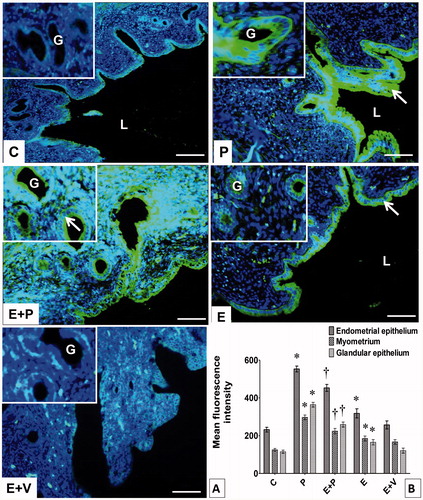
Figure 3. Distribution and expression levels of CAII in uterus. (A) CAII was distributed in different uterine compartments, i.e., epithelia and myometrium. Arrow pointing towards CAII distribution in the endometrial and glandular epithelia. L: lumen, G: gland, Scale bar = 100 μM. (B) Levels of CAII protein in different uterine compartments. Y-axis represents the mean fluorescence intensity while x-axis represents different groups of treatments. The highest fluorescence intensity for CAII was observed in epithelia and myometrium of progesterone-treated rats. All data were expressed as mean ± SEM from four independent observations. *p < 0.05 compared to C, †p < 0.05 compared to E + V. E: estrogen, P: progesterone, C: control, V: vehicle (control).
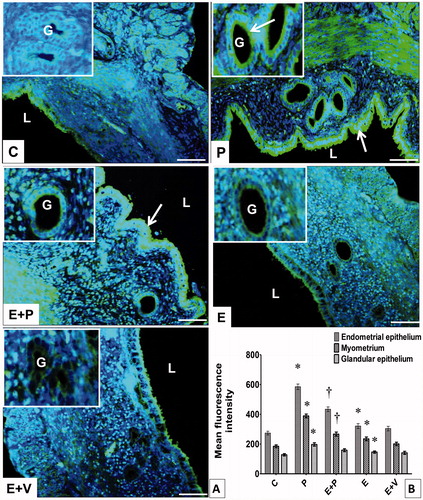
Figure 4. Distribution and expression levels of CAIII in uterus. (A) CAIII was distributed in different uterine compartments. Arrow pointing towards CAIII distribution in endometrial epithelium. L: lumen, G: gland, Scale bar = 100 μM. (B) Levels of CAIII protein in different uterine compartments. Y-axis represents the mean fluorescence intensity while x-axis represents different groups of treatments. The highest fluorescence intensity for CAIII was observed in epithelia and myometrium of progesterone-treated rats. All data were expressed as mean ± SEM from four independent observations. *p < 0.05 compared to C, †p < 0.05 compared to E + V. E: estrogen, P: progesterone, C: control, V: vehicle (control).
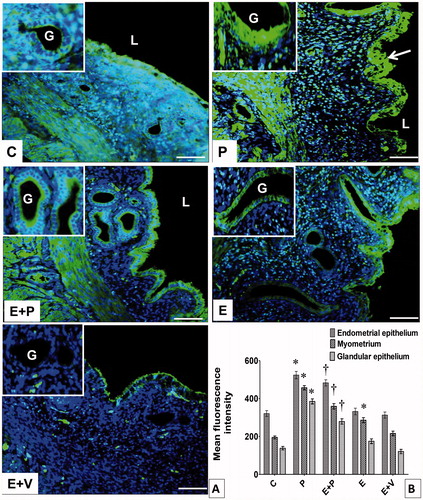
Figure 5. Distribution and expression levels of CAIX in uterus. (A) CAIX was distributed in different uterine compartments. Arrows point towards CAIX in endometrial epithelium. L: lumen, G: gland, Scale bar = 100 μM. (B) Levels of CAIX protein in different uterine compartments. Y-axis represents the mean fluorescence intensity while x-axis represents different groups of treatments. The highest fluorescence intensity for CAIX was observed in epithelia and myometrium of estrogen-treated rats. All data were expressed as mean ± SEM from four independent observations. *p < 0.05 compared to C, †p < 0.05 compared to E + V. E: estrogen, P: progesterone, C: control, V: vehicle (control).
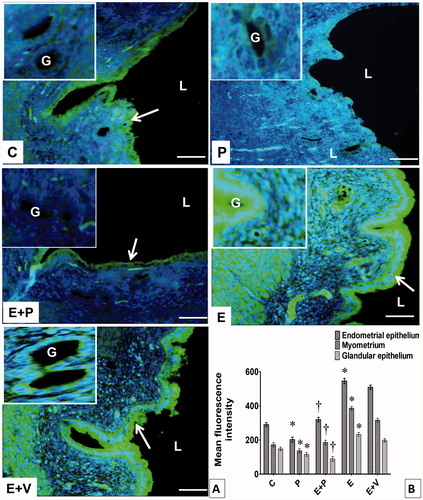
Figure 6. Distribution and expression levels of CAXII in uterus. (A) CAXII was distributed in different uterine compartments. Arrow pointing towards CAXII in endometrial epithelium. (B) Levels of CAXII protein in different uterine compartments. The highest fluorescence intensity for CAXII was observed in epithelia and myometrium of progesterone-treated rats. All data were expressed as mean ± SEM from four independent observations. *p < 0.05 compared to C, †p < 0.05 compared to E + V. E: estrogen, P: progesterone, C: control, V: vehicle (control), L: lumen, G: gland, Scale bar = 100 μM.
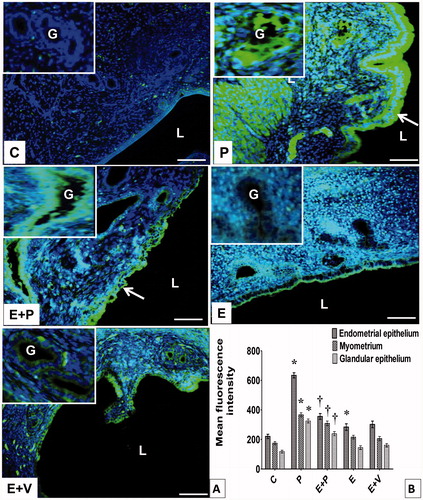
Figure 7. Distribution and expression levels of CAXIII in uterus. (A) CAXIII was distributed in different uterine compartments. Arrow pointing towards CAXIII in endometrial epithelium. L: lumen, G: gland, Scale bar = 100 μM. (B) Levels of CAXIII protein in different uterine compartments. The highest fluorescence intensity for CAXIII was observed in the epithelia and myometrium of progesterone-treated rats. All data were expressed as mean ± SEM from four independent observations *p < 0.05 compared to C, †p < 0.05 compared to E + V. E: estrogen, P: progesterone, C: control, V: vehicle (control).