Figures & data
Figure 1. Gastrocnemius muscle specimens of rat hind limb. Haematoxylin and eosin stain; left, above: cross-section (original magnification ×40) left, below: longitudinal section (original magnification ×40), right above; cross section (original magnification ×400), right below: longitudinal section (original magnification ×400). Group A: transplantation model, preservation time (a) 1 hour, no distinguishable change, (b) at 72 hours, focal necrosis and degenerative muscle were seen. (c) Group B: arterial ischaemic model, no definite changes. (d) Group C: GFP transplantation model, uniform muscle atrophy was obvious. Scale bars, 50 μm (original magnification ×40), 5 μm (original magnification ×400).
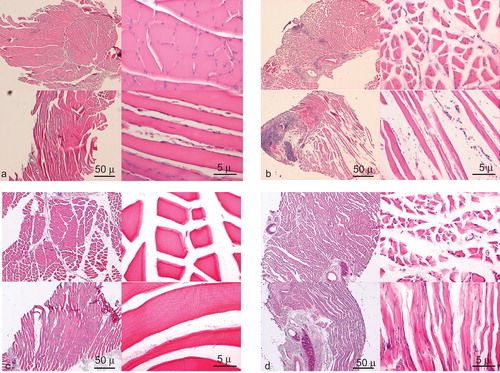
Figure 2. The results of measurement of the diameters of muscle cells in groups A, B, and C. In group A, the longer the ischaemic time, the more evident was muscle atrophy. In group B muscle atrophy was not pronounced. Group C showed severe atrophy. *p < 0.05.
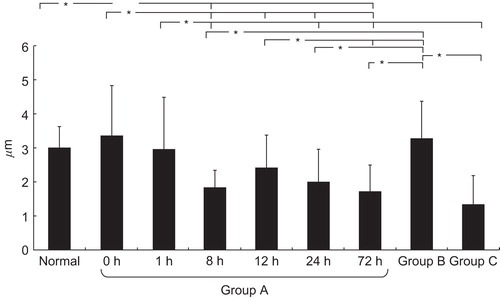
Figure 3. Distal motor latencies of the sciatic nerve. Comparison of shorter ischaemia group (0, 1 hours ischaemia), longer ischaemia group (8, 12 hours ischaemia), arterial ischaemic group, and normal controls. *p < 0.05.
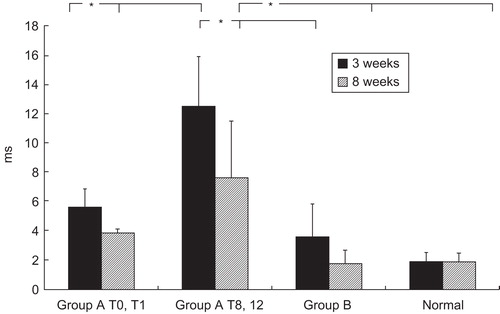
Figure 4. The GFP stained cells of the sciatic nerve in group D, the GFP transplantation model, at the point of 5 mm distal from suture. Cold preservation time 0 hour, at two weeks after transplantation. 489-nm wave length excitation light (original magnification ×40).
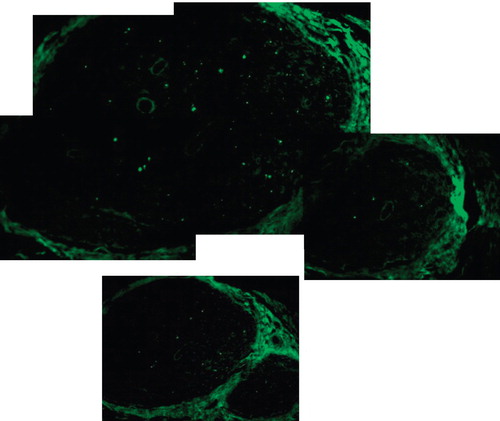
Table I. Numbers of GFP-S100 doubly-stained cells 5 mm distal from the anastomosis of the sciatic nerve. The difference between 0 hour and 12 hours cold preservation groups was significant. *p = 0.0002.