
Figures & data
Figure 1. An example of an acoustic rhinometry trace, with nasal cross-sectional area along the x-axis and distance from the wave tube along the y-axis. MCA = minimal cross-sectional area; VOL = nasal volume.
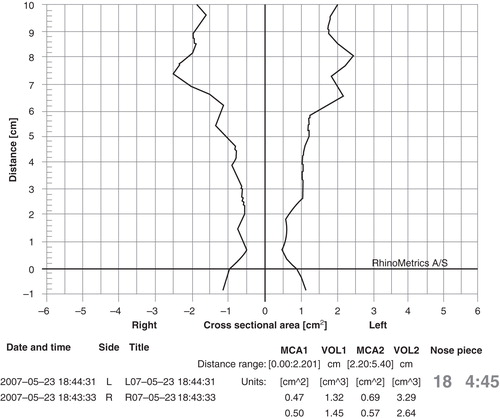
Table I. Acoustic rhinometry measurements of the cleft side and non-cleft side in 38 children with repaired complete unilateral CLP.
Table III. Comparison of acoustic rhinometry measurements of the non-cleft side in 38 children with repaired complete unilateral CLP and the mean value of the two nostrils of 21 control children without CLP.
Table II. Comparison of acoustic rhinometry measurements of the cleft side in 38 children with repaired complete unilateral CLP and the mean value of the two nostrils of 21 control children without CLP.