Figures & data
Figure 1. Effectiveness and sustainability of glycemic control with CSII therapy. Statistical analysis of HbA1c 0–3 months Pre-CSII vs all HbA1c intervals post-CSII. †p < 0.05, §p = 0.051, ¶p = 0.063. Data are represented as mean HbA1c. CSII, Continuous Subcutaneous Insulin Infusion; HbA1c, hemoglobin A1c; Mo, months.
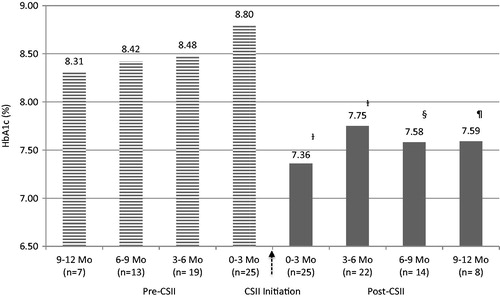
Table 1. Baseline characteristics and medications used prior ro CSII.
Table 2. Satisfaction survey results.