Figures & data
Table 1. Markers and inhibitors of human microsome enzyme activities.
Figure 1. Radioactive components in human plasma determined by thin layer chromatography, expressed as percent of extract radioactivity, after oral administration of 15 mg 14C-4-aminopyridine. (A) Mean proportions. (B) Mean concentrations.
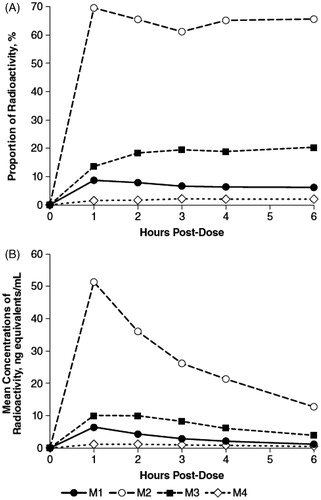
Figure 2. Gas chromatography/mass spectroscopy identification of M2 as 4-aminopyridine. Mass chromatograms of M2 (A) and authentic 4-aminopyridine (B), and mass spectra of M2 (C) and authentic 4-aminopyridine (D). Samples were derivatized prior to gas chromatography mass spectroscopy analysis.
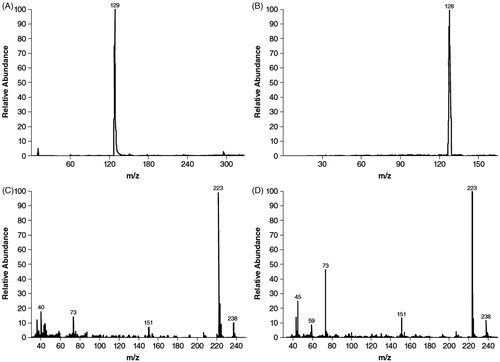
Figure 3. Mass spectra evaluation of M3 isolated from urine after oral administration of 15 mg 14C-4-aminopyridine to four human subjects. (A) Precursor electrospray ionization spectrum. (B) Product ion scan of m/z 189 ion of component M3.
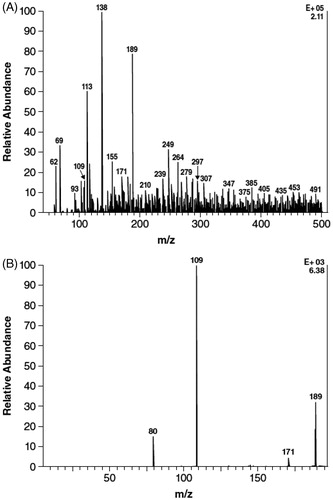
Table 2. Mean proportions of radioactive components in urine, 0–4 hours post-dose, determined by thin layer chromatography before and after enzyme hydrolysis, expressed as percent of sample radioactivity.
Figure 4. Formation of 3-hydroxy-4-aminopyridine from 4-aminopyridine (4-AP) with incubation of NADPH-fortified human liver microsomes. 11 mg microsomes/mL, 60 min incubations in the presence of NADPH. 2Single determination (one sample was below limit of quantitiation). BLQ, below limit of quantitation.
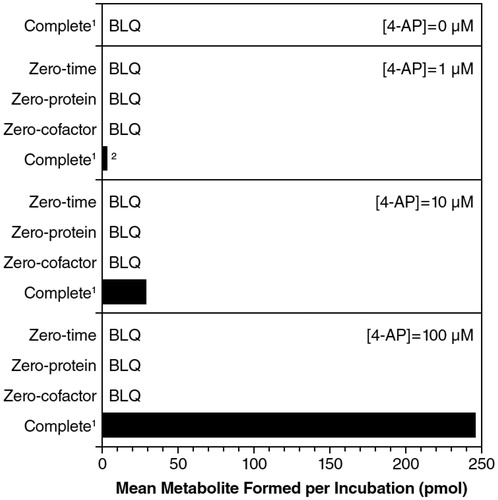
Figure 5. Eadie–Hofstee plots estimating the contribution of human liver microsome (1 mg protein/mL) enzyme(s) to the hydroxylation of 4-aminopyridine to 3-hydroxy-4-aminopyridine. (A) Total enzyme activity. (B) High affinity enzyme activity. (C) Low affinity enzyme activity.
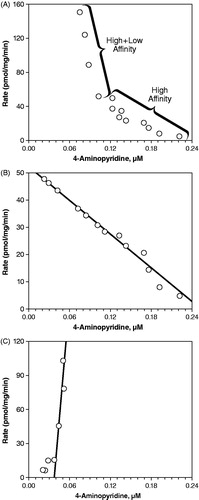
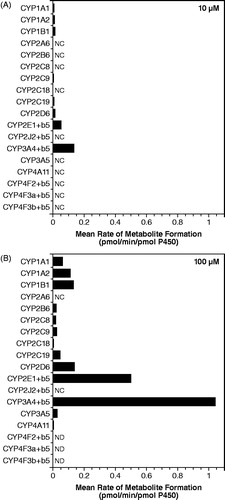
Figure 6. Conversion of 4-aminopyridine to 3-hydroxy-4-aminopyridine after incubation with recombinant human CYP enzymes. (A) 4-aminopyridine concentration 10 μM. (B) 4-aminopyridine concentration 100 μM. Values are blank-corrected with respect to controls. NC, not calculated since no value was detected, values were below the lowest standard, or were less than zero after blank correction; ND, not determined (samples were incorrectly prepared).