
Figures & data
Table 1. Demographic and baseline parameters.
Table 2. Treatment with single-pill combination of amlodipine/valsartan/hydrochlorothiazide (A + V + H), daily dose.
Table 3. Changes in treatment with amlodipine/valsartan/hydrochlorothiazide (A + V + H).
Figure 1. Time course of systolic and diastolic blood pressure—Mean values. mmHg, millimeters of mercury; sys, systolic; dia, diastolic.
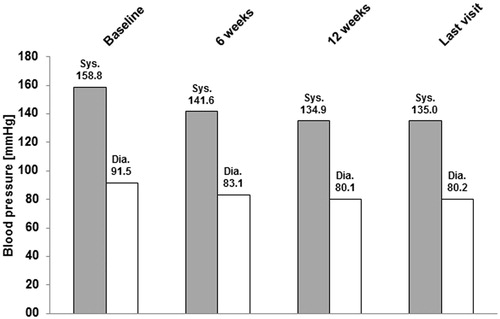
Figure 2. Absolute changes in blood pressure from start of observation. (a) Stratified by sBP at start of observation—Mean values. (b) Stratified by age at start of observation—Mean values. mmHg, millimeters of mercury; sys, systolic; dia, diastolic.
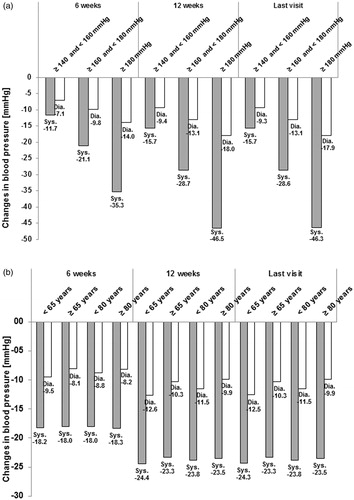
Table 4. Normalization of blood pressure and response at last visit.
Table 5. Most frequently reported adverse events (≥0.05% of patients).