Figures & data
Figure 1. Mean pH values on Day 1.
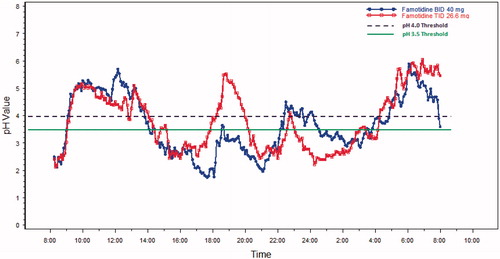
Figure 2. Mean pH values on Day 5.
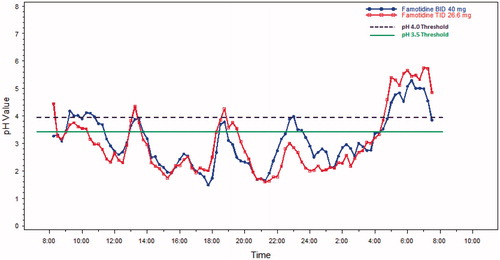
Table 1. Trough famotidine concentrations.
Figure 3. Mean observed vs fitted plasma famotidine concentrations single oral doses of 40 mg famotidine (Pepcid) (n = 30) (top) and ibuprofen 800 mg/famotidine 26.6 mg (n = 35) (bottom).
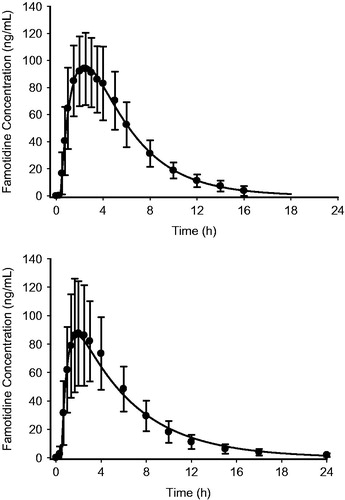
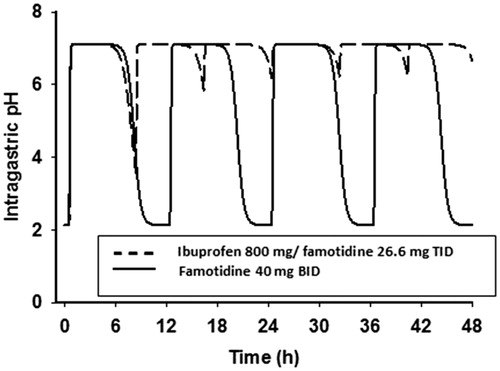
Figure 4. Predicted plasma concentration-time profiles of famotidine.
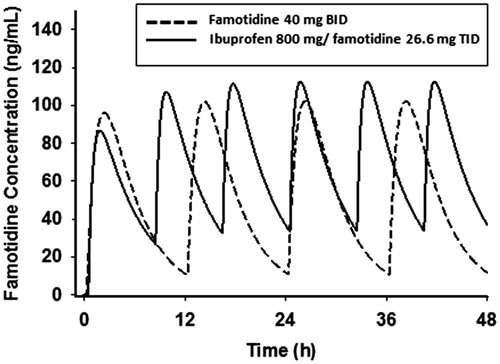
Table 2. Pharmacokinetic parameters of different famotidine formulations.
Figure 5. Predicted intragastric pH-time profiles of famotidine following a 5-min intravenous infusion of 0.5 mg/min famotidine.
Table 3. Pharmacodynamic parameters for famotidine.
Figure 6. Predicted intragastric pH-time profiles of famotidine.