Figures & data
Table 1. In vitro P-glycoprotein transporter investigation.
Table 2. Summary of demographic characteristics of the healthy male volunteers (n = 16).
Figure 1. Carmegliptin: Mean plasma concentration vs time profiles on days 1, 10, and 15 (linear scale, 0–12 h).
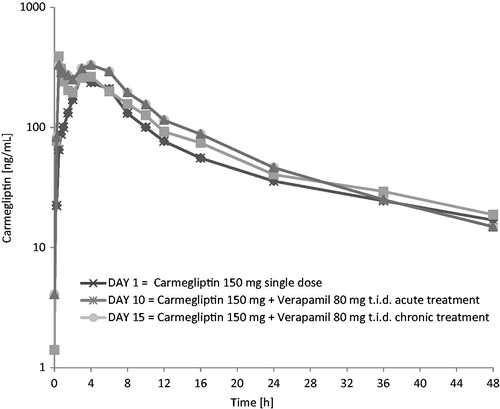
Figure 2. Carmegliptin: Mean plasma concentration vs time profiles on days 1, 10, and 15 (log-linear scale, 0–48 h).
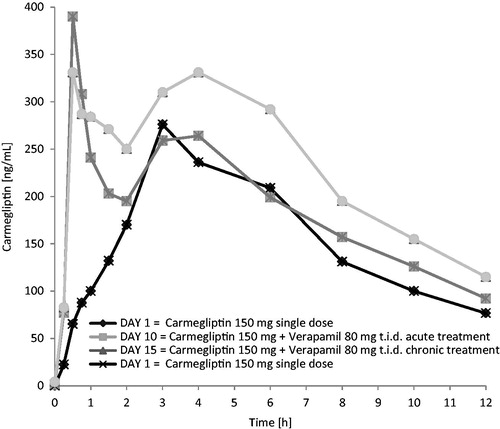
Figure 3. Carmegliptin: Mean cumulative urine recovery on days 1, 10, and 15.
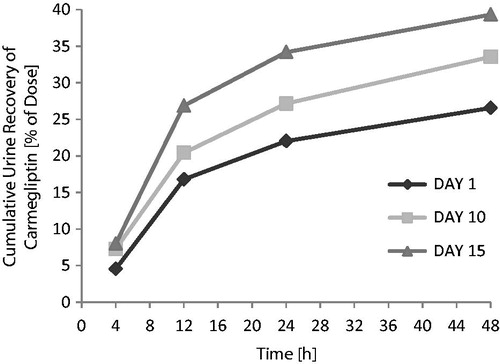
Table 3. Carmegliptin: Summary of pharmacokinetic parameters on days 1, 10, and 15.
Figure 4. Verapamil: Mean plasma concentration vs time profiles on days 7, 10, and 15 (linear scale, 0–24 h).
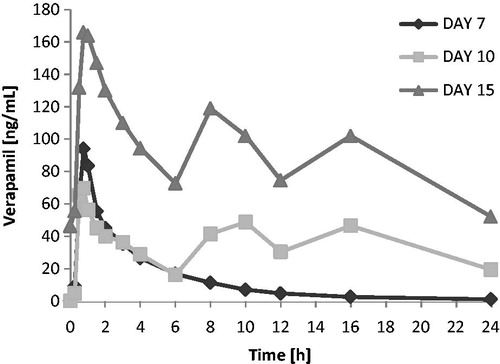
Table 4. Norverapamil: Summary of pharmacokinetic parameters on days 7 and 10.
Table 5. Verapamil: Summary of pharmacokinetic parameters on days 7 and 10.
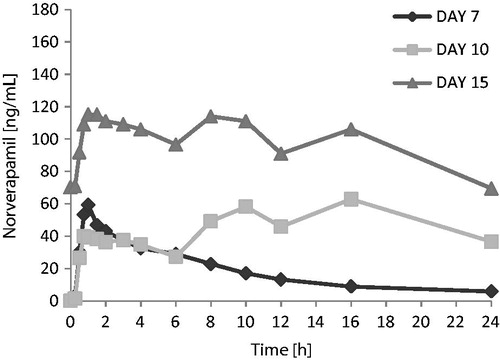
Figure 5. Norverapamil: Mean plasma concentration vs time profiles on days 7, 10, and 15 (linear scale, 0–24 h).