
Figures & data
Figure 1. Schematic demonstrating the experimental design.
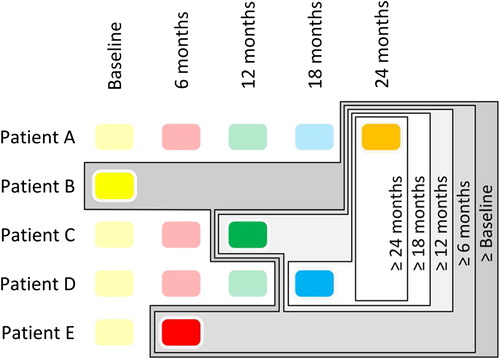
Figure 2. Example 1H NMR spectrum of CSF from an ALS patient with key metabolites identified.
Table I. Characteristics of patients with ALS, PLS and controls.
Figure 3. PLS-DA model plots. In each plot, the x-axis indicates patient number while the y-axis indicates discrimination for the model's component. (A) PLS-DA plot of CSF samples comparing ALS patients for whom the most advanced sample is greater than or equal to baseline (filled black triangles) and control volunteers (open black circles). (B) PLS-DA plot of CSF samples comparing ALS patients for whom the most advanced sample is greater than or equal to six months (filled black diamonds) and control volunteers (open black circles). (C) PLS-DA plot of CSF samples comparing ALS patients for whom the most advanced sample is greater than or equal to twelve months (filled black circles) and control volunteers (open black circles). (D) PLS-DA plot of CSF samples comparing ALS patients for whom the most advanced sample is greater than or equal to 18 months (filled black squares) and control volunteers (open black circles). (E) PLS-DA plot of CSF samples comparing ALS patients for whom the most advanced sample is greater than or equal to 24 (inverted filled black triangles) and control volunteers (open black circles). (F) Graph to show the q2-values of the models and their corresponding sample size.
Figure 4. Relative abundance of metabolites, normalized to control and determined by summed integral from the regions indicated in . Data are means ± SD. * = p < 0.05; ** = p < 0.01; *** = p < 0.001 all relative to control values.
Table II. Metabolite changes relative to control for metabolites of interest in the models.