
Figures & data
Table 1. Patient characteristics.
Figure 1. Pain relief. Patients were asked to rate the amount of relief that pain medications or treatments have provided in the past 24 h, ranging from 0% (no relief) to 100% (complete relief). Nearly a quarter obtained no relief from their pain.
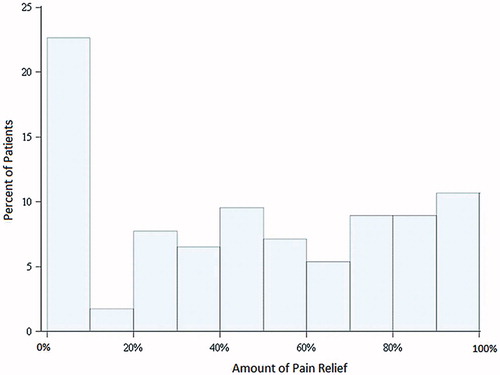
Table II. Pain features and management.
Table III. Descriptive statistics of depression, anxiety and self-efficacy.
Table IV. Correlations of depression, anxiety, self-efficacy, and pain.
Table V. Pain severity, interference, and relief: multiple linear regression.