Figures & data
Table I. Effect of Pyrimethamine concentration on drug loading.
Figure 1. (A) Photomicrograph of normal erythrocytes. (B) Photomicrograph of erythrocytes ghosts. (C) Photomicrograph of SEM of drug loaded nanoerythrosomes.
Figure 2. Cumulative percentage of pyrimethamine released from free drug solution and pyrimethamine-loaded nanoerythrosomes.
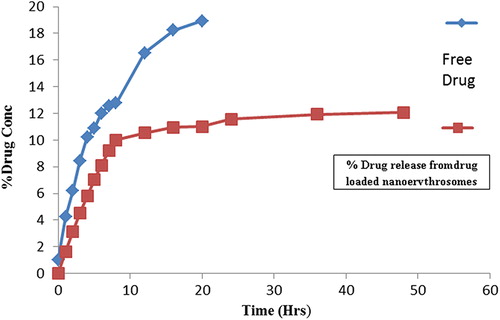
Table II. Effect of aging on turbidity and sedimentation volume of pyrimethamine-loaded nanoerythrosomes.
Table III. Effect of centrifugal force and turbulence shock on stability of drug-loaded nanoerythrosomes.
Figure 3. The blood plasma concentration of free drug solution and pyrimethamine-loaded nanoerythrosomes.
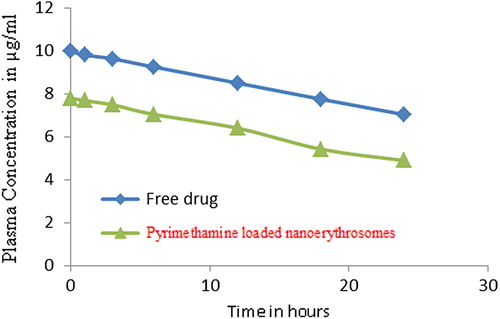
Figure 4. Tissue distribution of pyrimethamine loaded nanoerythrosomes at various time intervals (n = 3).
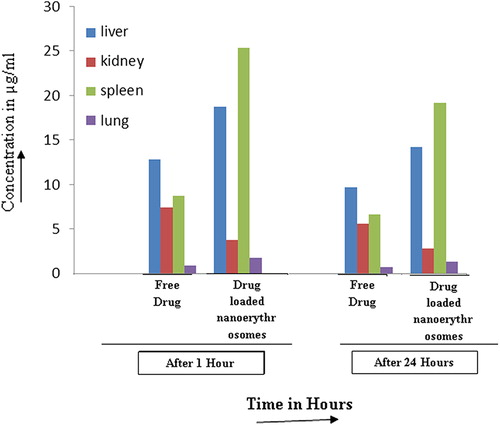
Table IV. Tissue distribution study of pyrimethamine and pyrimethamine-loaded nanoerythrosomes.