Figures & data
Figure 1. Illustration of MECC column for HIgG.
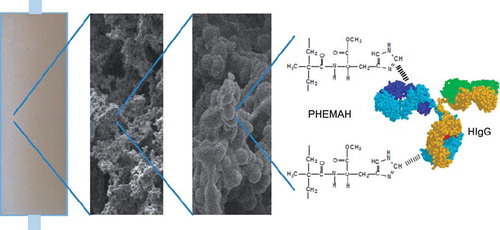
Table I. Swelling properties and flow resistance of cryogels.
Figure 2. SEM images of control cryogel column (A) and MECC column (B).
Figure 3. Effect of flow rate on HIgG adsorption; initial HIgG concentration: 2.5 mg/mL, pH 6.0 (phosphate buffer), T: 25°C, Time: 120 min.
Figure 4. (A) Effect of initial HIgG concentration on adsorption, (B) Adsorption isotherms on MECC column. MAH content: 35.3 μmol/g, pH 6.0 (phosphate buffer), flow rate: 1 mL/min, T: 25°C.
Table II. Effect of buffer type on HIgG adsorption. MAH content: 35.3 μmol/g; HIgG concentration: 2.5 mg/mL; flow rate: 1 mL/min; T: 25°C.
Figure 5. Effect of the ionic strength on HIgG adsorption, MAH content: 35.3 μmol/g, HIgG concentration: 2.5 mg/mL, pH 6.0 (phosphate buffer), flow rate: 1 mL/min, T: 25°C.
Figure 6. Effect of the amount of the embedded microspheres in cryogel column on HIgG adsorption. MAH content: 35.3 μmol/g, HIgG concentration: 2.5 mg/mL, pH 6.0 (phosphate buffer), flow rate: 1 mL/min, T: 25°C.
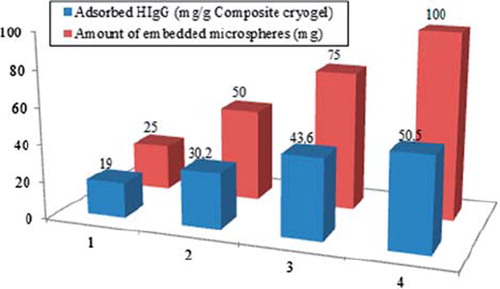
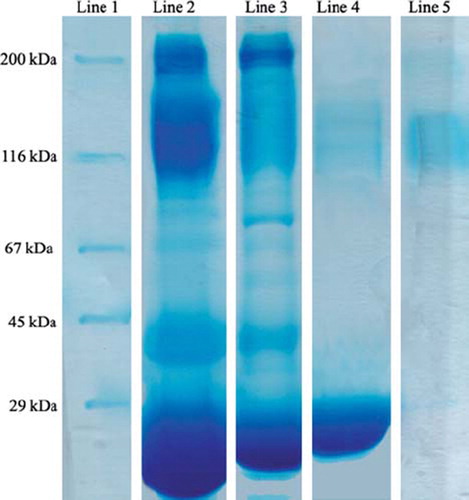
Figure 7. SDS-PAGE of serum samples before and after high-abundant protein removal. Lane 1: Protein marker. Lane 2: Crude serum. Lane 3: HIgG-depleted serum. Lane 4: Desorbed HIgG fraction. Lane 5: Standard HIgG solution.