Figures & data

Figure 1. Cyclic voltammograms of bare and ZnONPs modified carbon paste electrodes in 0.1 M pH 7.0 PBS in absence (a, c) and presence (b, d) of 1.0 mM H2O2 at scan rate of 50 mV s− 1.
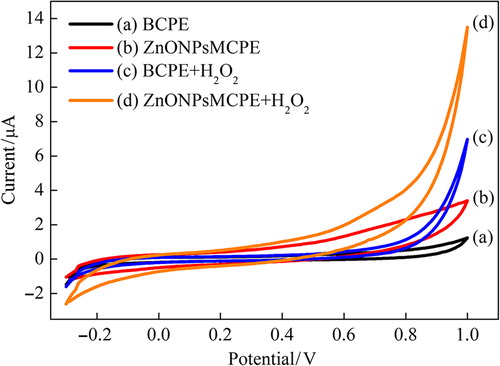
Figure 2. Effect of GOx unit on sensitivity of ZnONPs modified carbon paste enzyme electrode (0.1 M pH 7.0 PBS at + 0.4 V vs. Ag/AgCl).
Figure 3. Effect of pH value on sensitivity of ZnONPs modified carbon paste enzyme electrode (0.1 M pH 7.0 PBS at + 0.4 V vs. Ag/AgCl).
Figure 4. Effect of temperature on the sensitivity of ZnONPs modified carbon paste enzyme electrode (0.1 M pH 7.0 PBS at + 0.4 V vs. Ag/AgCl).
Figure 5. Effect of glucose concentration on amperometric response of ZnONPs modified carbon paste enzyme electrode, inset: linear working ranges plots (0.1 M pH 7.0 PBS at + 0.4 V vs. Ag/AgCl).

Figure 6. Substrate concentration/current response vs. substrate concentration plot (Hanes-Woolf plot).
Table I. Reusability and reproducibility for ZnONPs modified carbon paste enzyme electrode.
Figure 7. Storage stability of ZnONPs modified carbon paste enzyme electrode stored at 4°C (The applied potential + 0.4 V vs. Ag/AgCl).
Table II. Effects of interferences on glucose response.
Table III. The determination of glucose levels in human serum samples.