Figures & data
Figure 1. The schematic diagram of approaches of feeding gluaraldehyde.
Figure 2. Effects of poly-hemoglobin with the approaches of feeding gluaraldehyde (n = 3).
Figure 3. Effects of poly-hemoglobin with the hemoglobin concentration (n = 3).
Figure 4. Effects of poly-hemoglobin with the molar ratio of gluaraldehyde and hemoglobin (n = 3).
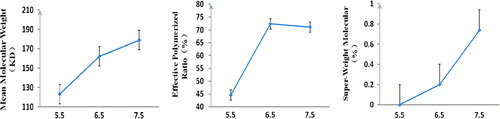
Table I. The molecular weight distribution of poly-hemoglobin and final products based on optimal process (n = 3).
Figure 5. Secondary structure of final products with circular dichroism (A). Compared with the secondary structure of the storma-free human placenta hemoglobin (B), the secondary structure of final products is consistent. This can be very obviously explained by the process of crosslinking without disrupting the secondary structure.