Figures & data
Figure 1. Ultrasound Transit Flow Probes. A constant flow of 10 ml/min extracts blood from the carotid artery and returns it into the jugular vein. Saline injections into the venous line lowers blood density, which is detected by the venous flow probe and triggers automatic cardiac output measurement (Original Drawing).
Figure 2. Mean arterial pressure and heart rate monitoring. Hypotension was maintained for 30 minutes around 40 mmHg by periodically withdrawing blood.
Figure 3. Changes after hypovolemic shock and treatment with low-volume resuscitation fluids (Solid Line = KRF, Dashed Line = LR). A) Cardiac index, B) Stroke volume, C) Mean arterial pressure, D) Oxygen delivery.
Table I. Hemodynamics and arterial blood gases: low volume resuscitation, short term assessment.
Figure 4. Changes after hypovolemic shock and treatment with low-volume resuscitation fluids (Solid line = KRF, Dashed Line = LR). A) Actively Circulating Volume, B) Central Blood Volume.
Figure 5. Changes after hypovolemic shock and treatment with full-volume resuscitation fluids (Solid Line = KRF, Dashed Line = LR). A) Cardiac index, B) Stroke volume, C) Mean arterial pressure, D) Oxygen delivery.
Figure 6, Changes after hypovolemic shock and treatment with full-volume resuscitation fluids (Solid Line = KRF, Dashed Line = LR). A) Actively Circulating Volume, B) Central Blood Volume.
Table II. Hemodynamics and arterial blood gases: full volume resuscitation, short term assessment.
Table III. Hemodynamics, arterial blood gases and electrolytes: long term assessment.
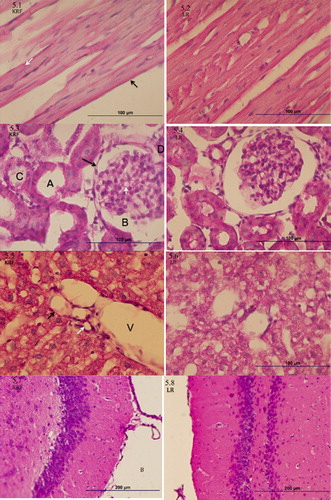
Figure 7. Tissue Histology. 5.1-5.2 Cardiac Muscle Histology. Endocardial simple squamous epithelium marked by black arrow, intercalated disk marked by white arrow, normal muscle striations are evidence throughout the tissue. 5.3-5.4 Renal Histology. Simple squamous epithelium (black arrow), Bowman space (B), glomerular basement membrane (white arrow tip), loop of Henle tubule (A) and proximal convoluted tubule (C), arterial pole (D). 5.5-5.6 Liver Histology. Portal triad composed of Portal vein (V), hepatic artery (black arrow) and bile duct (white arrow). 5.7-5.8 Brain Histology. Coronal cut through the medial thalamus (A) and surrounding third ventricle (B).