Figures & data
Figure 1. Chemical structure of the polymerization reagent used DSS.
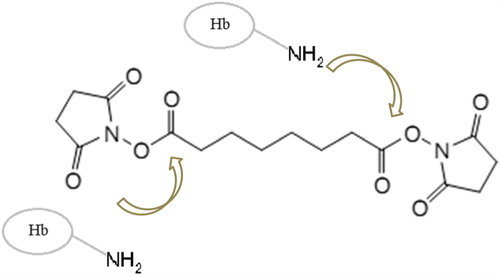
Figure 2. SDS–PAGE of polyHb. 1: native Hb; 2: 1Hb 8GL; 3: 1Hb 2BSA 8GL; 4: 1Hb 2BSA 5DSS; 6: 1Hb 2BSA 5DSS 8GL; and M: marker.
Figure 3. Size exclusion chromatograms for selected samples.
Figure 4. UV–vis spectra of GL-polymerized Hbs as prepared and after incubation at 37°C for 4 h.
Table I. Autooxidation rates (values compared with native Hb), rate constants (Kd), and Hill coefficients (n) for polyHb and native Hb.
Figure 5. The reaction of GL-polymerized Hb (A) and DSS-polymerized Hb (B) with H2O2. Conditions: room temperature, PBS 10 μM protein, 80 μM H2O2.
Figure 6. EPR spectra of 200 μM protein treated with 500 μM H2O2 in PBS and frozen at 30 s after mixing.