Figures & data
Figure 1. SEM photomicrograph. (A) CHMps, (B) A-CHMp.
Table I. Table showing particle size, zeta potential, % loading efficiency and % loading capacity.
Figure 2. FT-IR spectra. (A) Figure Ccomparing FTIR spectra of chitosan and CHMps; (B) Figure Ccomparing FTIR spectra of CHMps, sodium alginate, and A-CHMps.
Figure 3. DSC spectra. Figure comparing DSC spectra of chitosan, CHMps, sodium alginate, and A-CHMps.
Figure 4. SDS–PAGE Analysis. SDS–PAGE showing stability of antigen isolated from particulate formulation. Lane 1: Marker proteins (205-kDa myosin, rabbit muscle; 97-kDa phosphorylase B; 67-kDa BSA; 43-kDa ovalbumin; and 29-kDa carbonic anhydrase); Lane 2: native rPA (83 kDa); and Lane 3: rPA isolated from A-CHMps (83 kDa).
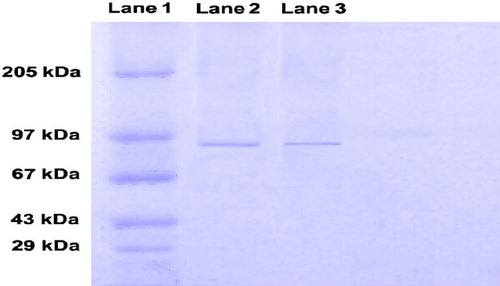
Figure 5. In vitro release. Graph showing percentage of antigen release with respect to time in SGF (pH, 1.2) and SIF (pH, 6.8).
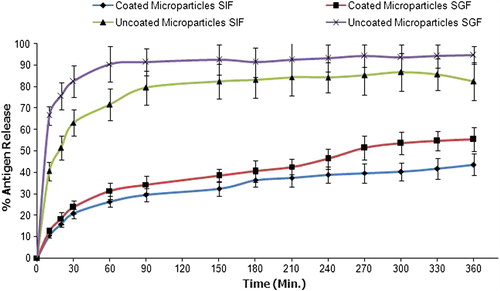
Figure 6. In vitro Mucoadhesion Measurement. Graph showing FITC–BSA amount washed away vs time.
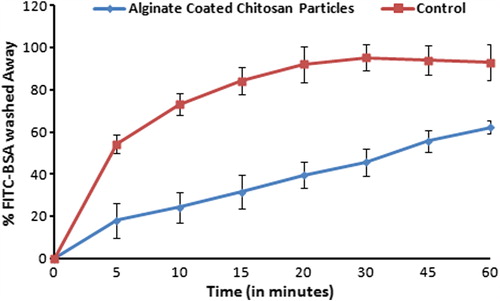
Figure 7. Fluorescence photograph of mice peyer's patch. (A). Mice treated with FITC-BSA solution; (B). Mice treated with A-CHMps loaded with FITC–BSA. Hot-Spot indicated by arrows showing the uptake of A-CHMps by peyer's patch of mice.
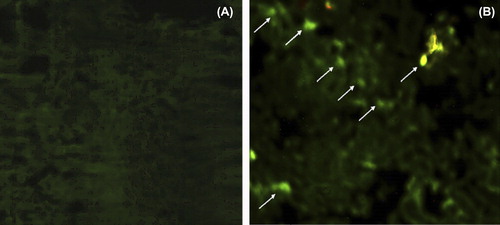
Figure 8. Anti-PA Antibody Titer. Graph showing anti-PA antibody titer in serum [A] and secretion [B]. Anti-PA antibody titer is expressed as the reciprocal dilution titers ± SE (n = 6), which gave an optical density (OD) above negative control. Abbreviation used in graph indicated the various groups used for the study and are as follows: rPA – Group fed with soluble rPA (100 μg), CN10 – Group fed with A-CHMps containing 10 μg rPA, CN25 – Group fed with A-CHMps containing 25 μg rPA; CN40 – Group fed with A-CHMps containing 40 μg rPA and CN55 – Group fed with A-CHMps containing 55 μg rPA, Alum-adsorbed rPA – Group injected s.c. with 10 μg of alum-adjuvanted rPA. Asterisk over bars indicated degree of significance. Where, [* = p < 0.05; ** = p < 0.01; *** = p < 0.001; ns = not significant].
![Figure 8. Anti-PA Antibody Titer. Graph showing anti-PA antibody titer in serum [A] and secretion [B]. Anti-PA antibody titer is expressed as the reciprocal dilution titers ± SE (n = 6), which gave an optical density (OD) above negative control. Abbreviation used in graph indicated the various groups used for the study and are as follows: rPA – Group fed with soluble rPA (100 μg), CN10 – Group fed with A-CHMps containing 10 μg rPA, CN25 – Group fed with A-CHMps containing 25 μg rPA; CN40 – Group fed with A-CHMps containing 40 μg rPA and CN55 – Group fed with A-CHMps containing 55 μg rPA, Alum-adsorbed rPA – Group injected s.c. with 10 μg of alum-adjuvanted rPA. Asterisk over bars indicated degree of significance. Where, [* = p < 0.05; ** = p < 0.01; *** = p < 0.001; ns = not significant].](/cms/asset/54cf4337-900d-4b32-b8b2-f67f54a300bc/ianb_a_769447_f0008_b.jpg)
Figure 9. Neutralizing Antibody Titer. Graph showing neutralizing antibodies titer in serum [A] and secretions [B]. End-point titer is expressed as the reciprocal dilution titers ± SE (n = 6), which gave an optical density (OD) above negative control. Note: Free rPA and alum-adsorbed rPA could not generate detectable neutralizing antibody titer in examined secretions.
![Figure 9. Neutralizing Antibody Titer. Graph showing neutralizing antibodies titer in serum [A] and secretions [B]. End-point titer is expressed as the reciprocal dilution titers ± SE (n = 6), which gave an optical density (OD) above negative control. Note: Free rPA and alum-adsorbed rPA could not generate detectable neutralizing antibody titer in examined secretions.](/cms/asset/f583b395-48a9-4161-ae03-e1e6d0b9146d/ianb_a_769447_f0009_b.jpg)
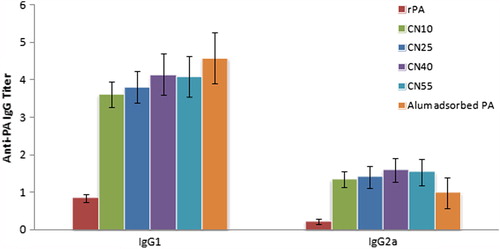
Figure 10. Antibody Subtyping. Graph showing anti-PA IgG1 and IgG2a titers. End-point titer is expressed as the reciprocal dilution titers ± SE (n = 6), which gave an optical density (OD) above negative control.