
Figures & data
Figure 1. Expression of sTRAIL gene in U251 cells. DAPI staining was also performed to visualize the apoptosis by assessing chromatin condensation. 1: Ad-sTRAIL group; 2: Ad-eGFPgroup.
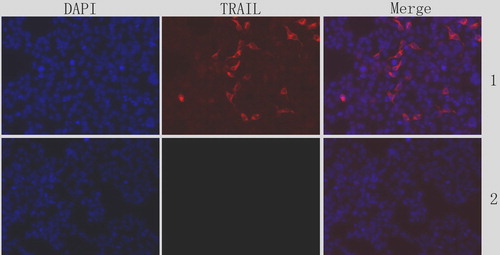
Figure 2. The morphological changes under light microscope. a: normal cells(× 40); b: cells infected by Ad-sTRAIL (× 40).
Figure 3. The morphological changes under immunofluorescence microscope. a: cells infected by Ad-eGFP for 24 h; b: cells infected by Ad-eGFP for 48 h; c: cells infected by Ad-sTRAIL for 24 h; and d: cells infected by Ad-sTRAIL for 48 h.
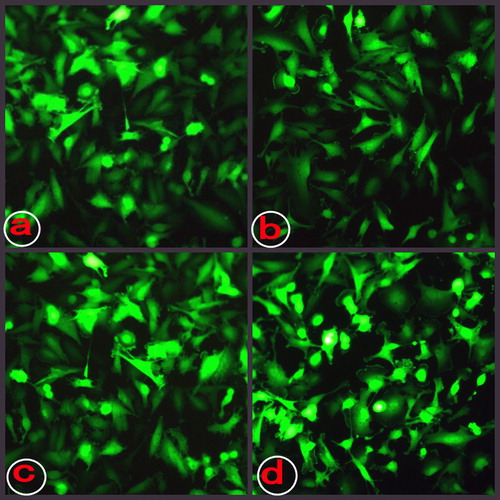
Figure 4. The survival rates of U251 cells were decreased with the increase in the MOI.
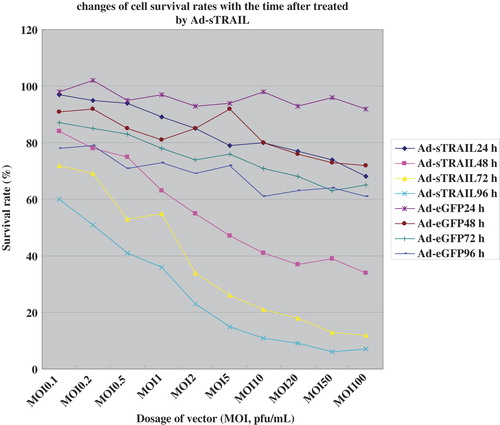
Figure 5. The survival rates of U251 cells had been a sharp decline with the increase in time.
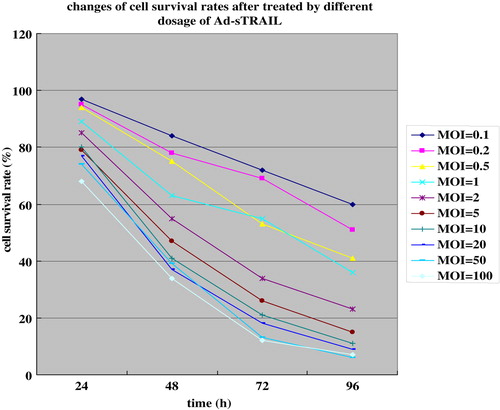
Table I. Apoptosis rate of U251 cells after 48 h treated with virus vector (MOI = 100) (%, ![]() ± SD).
± SD).
Table II. Cell cycle of U251 cells after 48 h treated with virus vector (MOI = 100) (%, ![]() ± SD).
± SD).