Figures & data
Table I. Changes in the serum amylase levels (U/L) and pathological scores of pancreatic injury in four groups (n = 8).
Figure 1. Representative images of histological examination of pancreas in each group at 12 h were shown by hematoxylin and eosin staining (original magnification × 100). There were no remarkable pancreatic injury pathological changes in the control group (A) and the BML-111 control group (B). The broad necrosis of acinar (closed arrows), inflammatory cell infiltrates (open arrows), and interstitial edema (arrowheads) were observed in APALI group (C). The slight local necrosis, inflammatory cell infiltrates, and interstitial edema were only observed in the BML-111-pretreatment group (D).
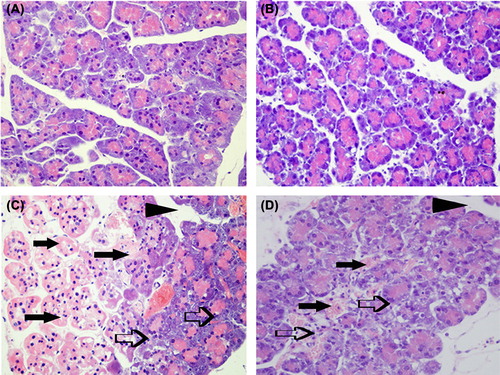
Table II. Changes in the lung wet/dry weight ratio and pathological scores of lung injury in four groups (n = 8).
Figure 2. Representative images of histological examination of lung in each group at 12 h were shown by hematoxylin and eosin staining (original magnification × 100). There were no remarkable pathological changes in the control group (A) and BML-111 control group (B). In the APALI group (C), the lung tissues show widespread alveolar wall thickness (arrowheads) caused by edema, severe hemorrhage (open arrows) in the alveolus, alveolus collapse, and obvious inflammatory cell infiltration (closed arrows). In BML-111-pretreatment group (D), the changes in the lung were edema and mild hemorrhage in the alveolus.
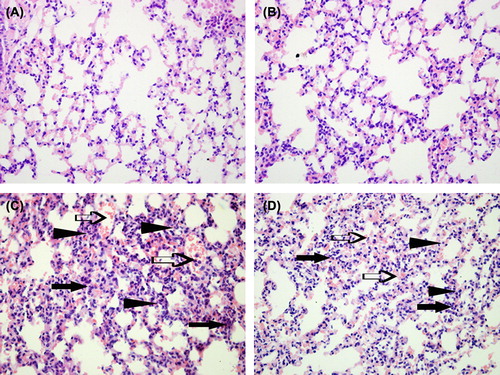
Figure 3. Changes in serum TNF-α, IL-1β, and IL-10 levels in four groups. The control group (CON), the BML-111 control group (BML), the APALI group (APALI), and the BML-111 pretreatment group (APALI + BML). A, serum TNF-α level; B, serum IL-1β level; C, serum IL-10 level; 3, 6, 12 and 24 h represent the time point at which animals were killed. Values are expressed as the means ± SD; #p < 0.05 vs. control group; ##p < 0.01 vs. control group. *p < 0.05 vs. APALI group; **p < 0.01 vs. APALI group.
Figure 4. Representative transmission electron microscopy images of lung tissues were shown in four groups at 12 h (original magnification of × 10000). The control group (A) and BML-111control group (B) showed complete mitochondrial outer membrane and distinct mitochondrial cristae in type Ⅱ alveolar epithelial cell. The APALI group (C) showed mitochondrial swelling and outer membrane blurred (open arrows), mitochondrial cristae disappeared, vacuolar degeneration of lamellar body (arrowheads), red blood cells (closed arrows) and the active substance were leaked into the alveolar space. The BML-111 pretreatment group (D) showed slight swelling of mitochondria, incomplete mitochondrial cristae, and little vacuolar degeneration in lamellar body.
Figure 5. Changes in expression of HO-1 mRNA in lung tissues. Real-time PCR analysis of expression of lung HO-1 mRNA in the control group (CON), the BML-111 control group (BML), the APALI group (APALI), and the BML-111 pretreatment group (APALI + BML).The differences in the average threshold cycle (2−ΔΔCT) values were determined and normalized to the expression of β-actin; 3, 6, 12 and 24 h represent the time points at which animals were killed. Values are expressed as the means ± SD; #p < 0.05 vs. control group; ##p < 0.01 vs. control group. *p < 0.05 vs. APALI group; **p < 0.01 vs. APALI group.
Figure 6. Changes in expressions of HO-1 protein in lung tissues. Western blotting analysis of expression of lung HO-1 in the control group (CON), the BML-111 control group (BML), the APALI group (APALI) and the BML-111 pretreatment group (APALI + BML) at four time points. β-Actin was the internal control. A a, representative image of HO-1 protein in lung tissues at 3 h in each group; A b, representative image of HO-1 protein in lung tissues at 6 h in each group; A c, representative image of HO-1 protein in lung tissues at 12 h in each group; and A d, representative image of HO-1 protein in lung tissues at 24 h in each group. B, the histogram of the average expression of HO-1 protein in lung tissue in the control group (CON), the BML-111 control group (BML), the APALI group (APALI), and the BML-111 pretreatment group (APALI + BML). Values are expressed as the means ± SD; #p < 0.05 vs. control group; ##p < 0.01 vs. control group. *p < 0.05 vs. APALI group; **p < 0.01 vs. APALI group.