Figures & data
Figure 1. Decreased cisplatin-sensitivity of McA-RH7777 cells under hypoxia. Rat hepatoma cell line McA-RH7777 was cultured in either normoxic (Nx) or hypoxic (Hx) condition (1%) in the presence of cisplatin for 24 h or 48 h. Cell survival was then assessed by MTT assay. *p < 0.05.
Figure 2. Attenuation of hypoxia by OC89 in tumor tissues. The rats were divided into two groups, being given either Ringer's buffer or oxygen carrier via tail vein injection. pO2 readings were measured both before and 1 h after interference. (a) Improved oxygenation by OC89. The data were shown as mean ± SD. * p < 0.05. (b) Shift of pO2 fraction from low (0–10 mmHg) to high readings (15–25 mmHg) after OC89 delivery. (c) Expression of hypoxia marker pimonidazole after interference. Immunostaining showed less binding to pimonidazole (lower panel) in tumor tissue after delivery of OC89 (Bar = 100 um).
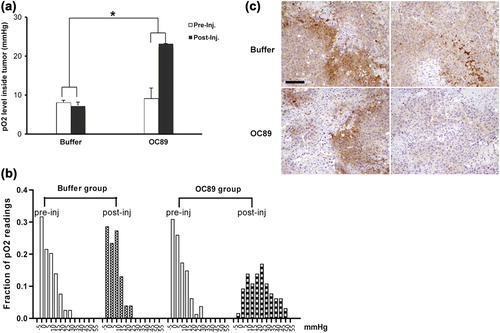
Table I. pO2 readings (mmHg) inside tumor tissue before and after OC89 delivery.
Table II. Tumor volume changes in different therapeutic regimens.
Figure 3. Enhanced therapeutic effect in TACE by OC89. (a) MRI or xenogen images in rats before or after TACE with or without OC89 delivery. The images were taken at Day 0 (left panel) or 21 days after TACE (middle and right panel). (b) Macro- and microscopic evaluation of tumors 21 days after TACE. In OC89-treated rat, the implanted tumor was replaced by granuloma (lower right, arrow) and proliferative fibrous tissue; while in rats receiving buffer, living tumor cells (lower left, solid arrow) accompanied with partial necrosis (lower left, dashed arrow) were observed. Bar = 20 um. (c) and (d) Altered expression of GRP78 and CHOP in rats at Day 1 after TACE. Bar = 100 um. (e) and (f) Increase of apoptosis (TUNEL assay, Day 1) and inhibition of proliferation (Immunostaining of Ki-67, Day 21) by OC89 in tumor cells after TACE. Bar = 100 um. *p < 0.05.
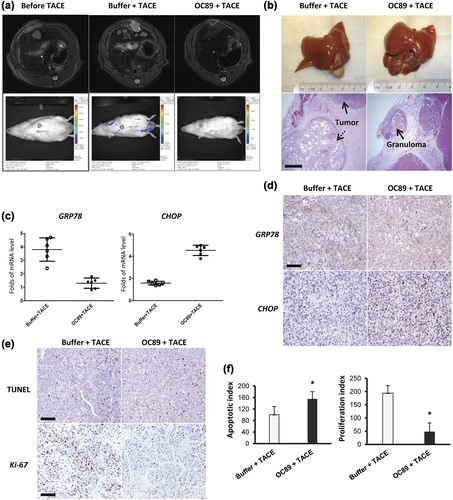
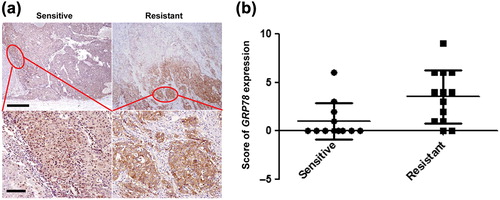
Figure 4. Differential expression of GRP78 in human TACE-sensitive or resistant HCC. (a) Weak staining of GRP78 in tumor cells of TACE-sensitive HCC and strong positivity in tumor cells of TACE-resistant HCC (Upper panel, Bar = 20 um; lower panel, bar = 100 um). (b) Scoring of GRP78 staining. The scoring was calculated based on both staining intensity and area of positivity.