Figures & data
Figure 1. Schematic presentation of anchoring of LTA lectin to surface of Chitosan nanoparticles with glutaraldehyde as cross-linker.
Table I. HBsAg loaded vaccine formulation for immunization study.
Table II. Characteristics of chitosan nanoparticles and lectinized chitosan nanoparticles.
Figure 2. Atomic force Microscopy of plain Chitosan nanoparticles (A) and lectin-anchored chitosan nanoparticles (B).

Figure 3. Effect of different amount of per cent glutaraldehyde on the coupling capacity of LTA lectin to chitosan nanoparticles (n = 3).
Figure 4. In vitro cumulative release of HBsAg from LTA-anchored PLGA nanoparticles (with and without stabilizer) and plain nanoparticles (n = 3). A. Percentage of in vitro antigen release of HBsAg from LTA-anchored Chitosan nanoparticles and plain nanoparticles (n = 3); B. In vitro antigenicity (response of enzyme immunoassay to protein concentration) of HBsAg in lectin-coupled Chitosan nanoparticles and plain chitosan nanoparticles during in vitro release study (n = 3).
Figure 5. SDS-PAGE analysis of ligand-anchored nanoparticles. Lane 1: Molecular weight marker of 225 kDa, Lane 2: Naive hepatitis B antigen, Lane 3: Naive LTA lectin and Lane 4: Lectin anchored Chitosan nanoparticles.
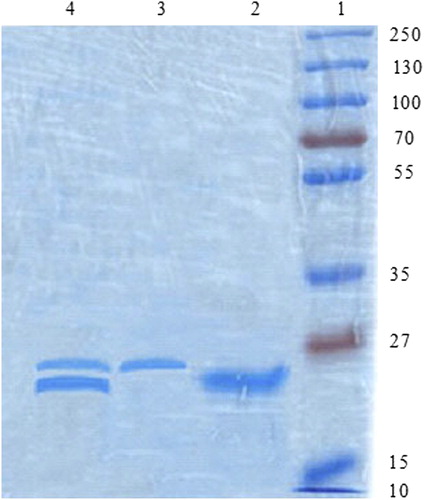
Figure 6 Binding of BSM to LTA-anchored Chitosan nanoparticles (LTA-CHNP-HB) and plain nanoparticles in suspension with and without competing sugar (α-L-fucose) and with non-specific or control sugar (D-galactose) (n = 3).
Figure 7. Confocal laser scanning microscopy images showing targeting of the nanoparticles to the M cells of the Peyer's patches in mice by dual staining. M cells were primarily stained with TRITC-WGA (red). FITC-LTA coupled Chitosan nanoparticles stain green. Control nanoparticles (FITC-BSA coated) shows little or no binding to M cells (A). Lectinized chitosan nanoparticles (shown by arrow) were associated predominantly with M cells (B).
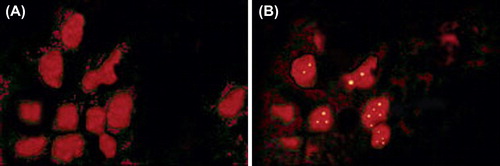
Figure 8. Serum anti-HBsAg profile of mice immunized with different formulations at booster immunization which was given after 2 weeks. Values are expressed as mean ± SD (n = 6).
Figure 9. sIgA level in the intestinal, salivary and vaginal secretions of mice immunized with various formulation after 6 weeks of booster immunization. Values are expressed as mean ± SD (n = 6).
Figure 10. IgG1 and IgG2a anti-HBsAg antibody isotypes at Day 42 in sera of mice. Values are expressed as mean ± SD (n = 6).
Figure 11. Interleukin-2 and Interferon-γ level in spleen homogenate of mice immunized with various formulations after 6 weeks of booster immunization. Values are expressed as mean ± SD (n = 6).