
Figures & data
Figure 1. Amperometric response of the Pt/Pani–Pvs, Pt/Pani–Pvs–Fc and Pt/Pani–Pvs–Mb electrodes to glucose [in the phosphate buffer (pH 7.5), 50 μL glucose oxidase (10 U/mL), 0.3 V].
![Figure 1. Amperometric response of the Pt/Pani–Pvs, Pt/Pani–Pvs–Fc and Pt/Pani–Pvs–Mb electrodes to glucose [in the phosphate buffer (pH 7.5), 50 μL glucose oxidase (10 U/mL), 0.3 V].](/cms/asset/60649e03-a01a-4d7a-beac-7a6183278c16/ianb_a_812650_f0001_b.jpg)
Figure 2. The effect of potential on the response of the Pt/Pani–Pvs–Fc electrode to glucose [in the Phosphate buffer (pH 7.5), 50 μL glucose oxidase (10 U/mL)].
![Figure 2. The effect of potential on the response of the Pt/Pani–Pvs–Fc electrode to glucose [in the Phosphate buffer (pH 7.5), 50 μL glucose oxidase (10 U/mL)].](/cms/asset/826c2f4c-dd6a-423c-92b8-36e82f8b19b9/ianb_a_812650_f0002_b.jpg)
Figure 3. The effect of potassium ferricyanide concentration on the response of the Pt/Pani–Pvs–Fc electrode to glucose [in the phosphate buffer (pH 7.5), 50 μL glucose oxidase (10 U/mL), 0.3 V].
![Figure 3. The effect of potassium ferricyanide concentration on the response of the Pt/Pani–Pvs–Fc electrode to glucose [in the phosphate buffer (pH 7.5), 50 μL glucose oxidase (10 U/mL), 0.3 V].](/cms/asset/7f5c2b2e-a7fd-48c9-af6f-35c67f7f9803/ianb_a_812650_f0003_b.jpg)
Figure 4. The effect of pH on the response of the biosensor at (25°C 5.0 × 10− 5 M glucose in operating potential 0.3 V).
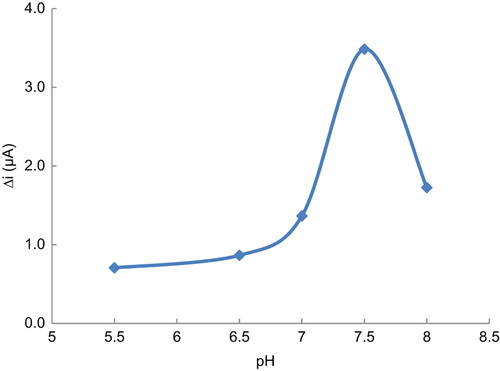
Figure 5. The effect of temperature on the response of the biosensor at (pH 7.5, 5.0 × 10− 5 M glucose in operating potential 0.3 V).
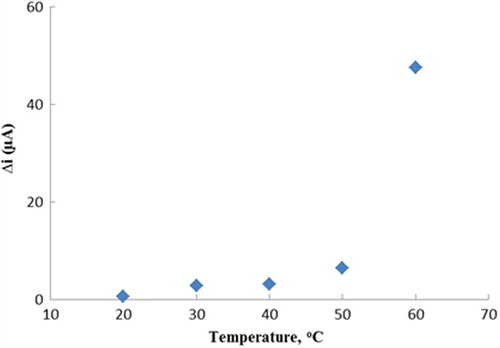
Figure 6. The calibration curve of glucose biosensor (pH 7.5 phosphate buffer 25°C operating potential 0.3 V).
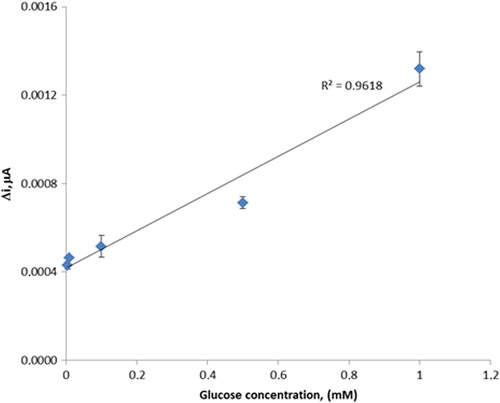
Figure 7. The effect of glucose concentration upon the amperometric response of the biosensor. [Lineweaver–Burk plot, in the phosphate buffer (pH 7.5) and operating potential 0.3 V, 25°C].
![Figure 7. The effect of glucose concentration upon the amperometric response of the biosensor. [Lineweaver–Burk plot, in the phosphate buffer (pH 7.5) and operating potential 0.3 V, 25°C].](/cms/asset/5aab7a45-ea1c-48bc-9f10-cfcdf9304058/ianb_a_812650_f0007_b.jpg)
Figure 8. Measure number of the biosensor [in the phosphate buffer (pH 7.5), in operating potential 0.3 V, 25°C].
![Figure 8. Measure number of the biosensor [in the phosphate buffer (pH 7.5), in operating potential 0.3 V, 25°C].](/cms/asset/86aacfc5-d19b-48f7-8734-540812356eab/ianb_a_812650_f0008_b.jpg)
Figure 9. Storage stabilization of the biosensor [in the phosphate buffer (pH 7.5), in operating potential 0.3 V, 25°C and substrate concentration 5.0 × 10− 5 M].
![Figure 9. Storage stabilization of the biosensor [in the phosphate buffer (pH 7.5), in operating potential 0.3 V, 25°C and substrate concentration 5.0 × 10− 5 M].](/cms/asset/8b7bd32e-14f9-41df-8b20-d28357a8723d/ianb_a_812650_f0009_b.jpg)