Figures & data
Scheme 1. Synthesis of palladium complex. Reagents and conditions: (i) 2,3,4,5,6-pentamethylbenzyl bromide, PhMe, 25°C; (ii) [Pd(μ-OAc)(ppy)]2, ppy: 2-phenylpyridine, PhMe, 110°C.
![Scheme 1. Synthesis of palladium complex. Reagents and conditions: (i) 2,3,4,5,6-pentamethylbenzyl bromide, PhMe, 25°C; (ii) [Pd(μ-OAc)(ppy)]2, ppy: 2-phenylpyridine, PhMe, 110°C.](/cms/asset/39912719-ddab-4ae0-9528-9025fd5e16ae/ianb_a_815193_f0001_b.gif)
Figure 1. Cyclic voltammograms (CVs) of bare and modified biosensors in different steps in phosphate buffer (pH 7.0), with a scan rate of 50 mVs− 1 vs Ag/AgCl. a) bare gold electrode, b) Cysteamine-modified gold electrode (CMAuE), c) Cysteamine–palladium complex-peroxidase-modified gold electrode (CPaPeMAuE) in the absence of H2O2, d) Cysteamine–palladium complex-peroxidase-modified gold electrode (CPaPeMAuE) in the presence of H2O2 (100 μM).
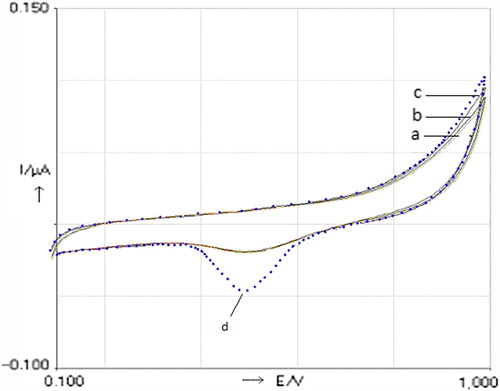
Figure 2. Chronoamperometric results of modified peroxidase biosensor after H2O2 injections with different concentrations at +0.47 V potential vs Ag/AgCl.
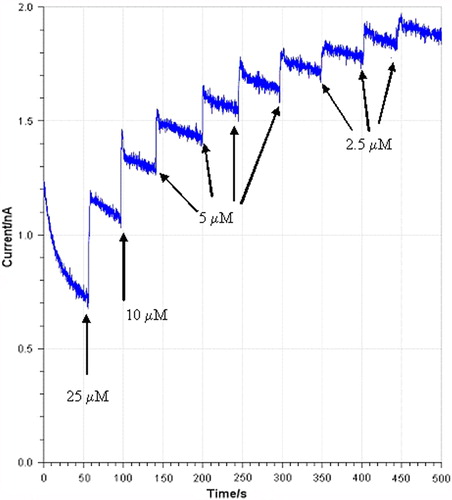
Figure 3. The amperometric response of the successive addition of H2O2 from 2.5 to 150 μM at + 0.47 V potential vs Ag/AgCl.
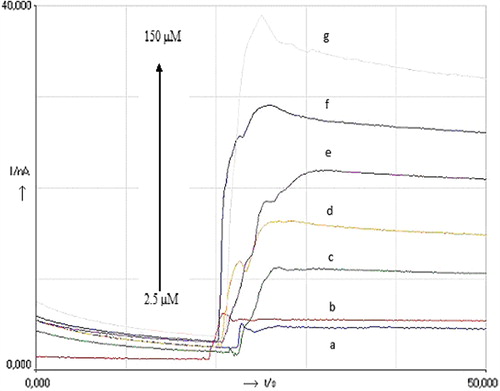
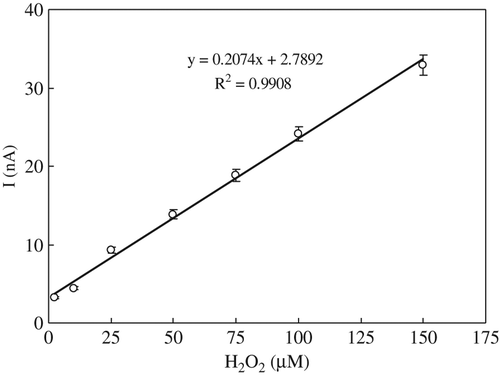
Figure 4. Calibration curve of the response current of the biosensor to H2O2 concentration.