
Figures & data
Scheme 1. The reaction mechanism between the redox center of POX and the electrode surface.
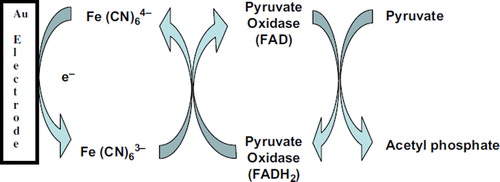
Figure 1. Cyclic voltammograms of bare AuE (a), AuE/3-MPA/6-ACA (b), AuE/3-MPA/6-ACA/POX/GA in the absence of pyruvate (c) and AuE/ 3-MPA/6-ACA/POX/GA in the presence of pyruvate (d) in phosphate buffer (pH 6.0, 50 mM containing 0.1 M KCl and 5.0 mM K3Fe(CN)6) at a scan rate of 50 mVs− 1 vs. Ag/AgCl.
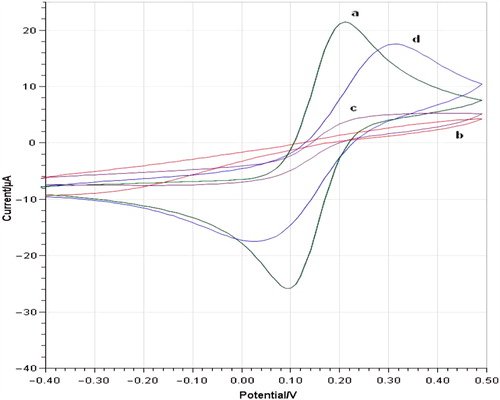
Figure 2. DP Voltammograms obtained for different concentration of pyruvate; a (0 μM), b (2.5 μM), c (10 μM), d (20 μM), e (30 μM), f (40 μM), g (50 μM). Inset shows the relationship between catalytic currents and pyruvate concentrations. Conditions: pH 6.0, 50 mM phosphate buffer (containing 0.1 M KCl and 5.0 mM K3Fe(CN)6) at 30°C. The percentage of glutaraldehyde and the activity of pyruvate oxidase were kept constant to be 2.5% and 0.356 UmL− 1, respectively.
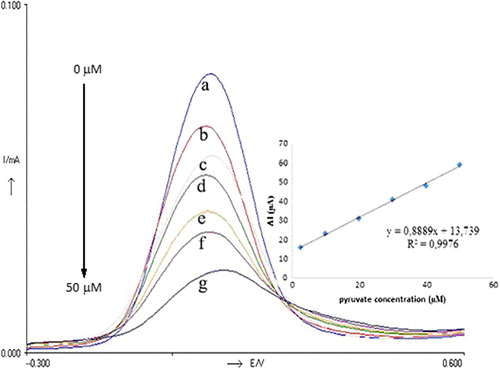
Figure 3. Current–time curves obtained with the biosensor upon successive addition of 1 mL 30 μM pyruvate. Inset shows the relationship between catalytic currents and pyruvate concentrations. Conditions: pH 6.0, 50 mM phosphate buffer (containing 0.1 M KCl and 5.0 mM K3Fe(CN)6) at the applied potential of 30 mV. The percentage of glutaraldehyde and the activity of pyruvate oxidase were kept constant to be 2.5% and 0.356 UmL− 1, respectively.
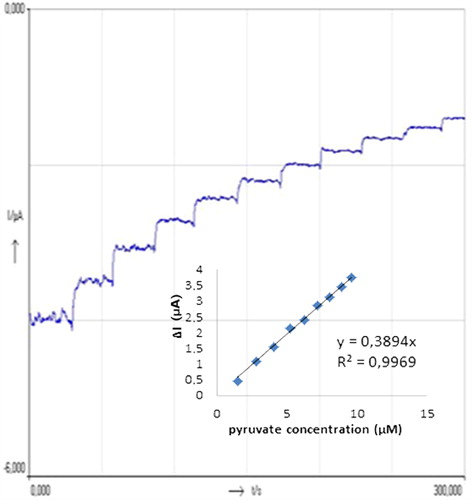
Table I. Comparison of performances of some biosensors developed for determination of pyruvate.