
Figures & data
Table I. Lipid composition for different vesicle formulations (Molar ratio).
Figure 1. TEM images of formulations (10000×); a: PC vesicle (PCV-3); b: Ceramide vesicle (CV-3). (a) PC vesicle (PCV-3); (b) Ceramide vesicle (CV-3).
Figure 2. Cumulative drug release profile (%).
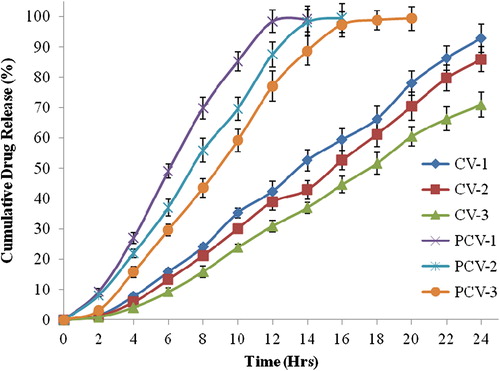
Table II. Physical characterization of formulations (PC vesicles and Ceramide vesicles).
Table III. Stability study of selected phosphatidylcholine vesicle (PCV-3).
Table IV. Stability study of selected ceramide vesicle (CV-3).