Figures & data
Figure 1. Synthesis of MAT monomer.
Figure 2. FTIR spectrum of cholesterol, MAT monomer and cholesterol–MAT monomer complex.
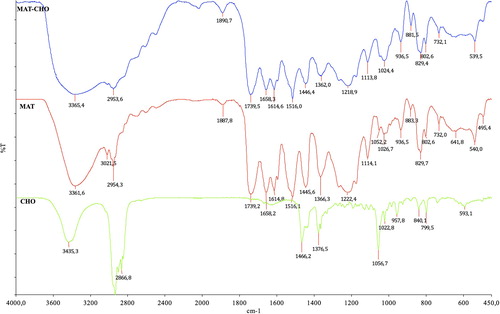
Figure 3. FTIR spectrum of PGMAT microspheres and PGMAT/PHEMA cryogel composite system.
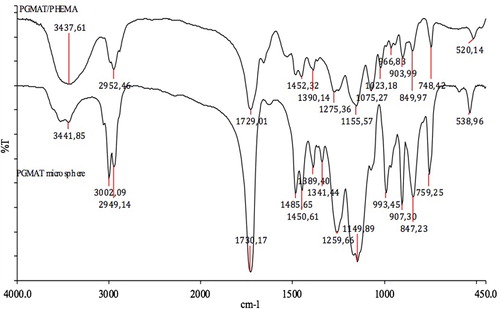
Table I. Swelling properties of the mip/nipPGMAT/PHEMA composite cryogels.
Figure 4. SEM images of PHEMA cryogels (A, B); PGMAT/PHEMA composite cryogels, (C, D) (macropore radius: ˜100 μm); Cholesterol-imprinted microspheres (E, F) (microsphere radius: ˜2 μm).
Figure 5. The chromatogram of cholesterol released from the mipPGMAT/PHEMA composite cryogel.
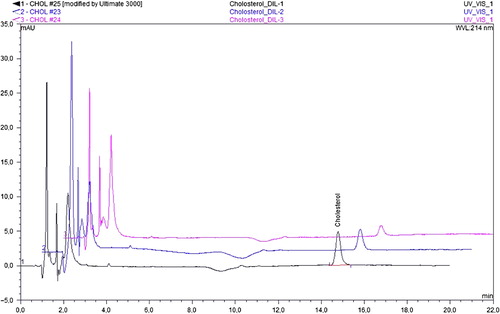
Table II. Statistical evaluation of the calibration data of cholesterol.
Figure 6. Effect of flow rate on cholesterol adsorption. Cholesterol concentration: 0.5 mg/mL, T: 20°C, Time: 2 h.
Figure 7. Effect of initial concentration of cholesterol on adsorption amount. Flow rate: 0.5 mg/mL, T: 20°C, Time: 2 h.
Table III. The Langmuir and Freundlich adsorption isotherm constants.
Table IV. The pseudo first/second order kinetic constants for mipPGMAT/PHEMA composite cryogel.
Figure 8. Molecular structures of the competitor molecules.
Figure 9. Adsorption of cholesterol in the presence of competitor estradiol and stigmasterol molecules on mip/nipPGMAT/PHEMA composite cryogels.
Table V. k, kd and k’ values of estradiol and stigmasterol with respect to cholesterol.
Table VI. Cholesterol removal from homogenized cow milk.
Figure 10. Reusability of mipPGMAT/PHEMA composite cryogel.