Figures & data
Figure 1. The oxidation of Hb and the tissue damaging of ROS.
Figure 2. The variation curve of oxygen content, Met-Hb and oxygen saturation in the process of reaction (200 min). Assay conditions: (A) instead of Hb solution with water and adding 200 times Vc or 1000 times NAC; (B) Hb is diluted with 0.2 M saline phosphate buffer, pH 7.4, to obtain 0.075 g/dL Hb solution; (C) condition as described in (A).
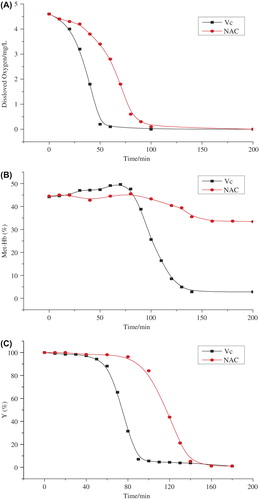
Figure 3. The reaction of ascorbate with TEMPO.
Figure 4. The variation curve of Met-Hb and oxygen saturation in the process of Vc and TEMPO without de-oxygenation. Assay condition: Hb is diluted with 0.2 M saline phosphate buffer, pH 7.4, to obtain 0.075 g/dL Hb solution and the pH of VC solution is adjusted to 7.4 before use. Oxygen is isolated in the whole process.
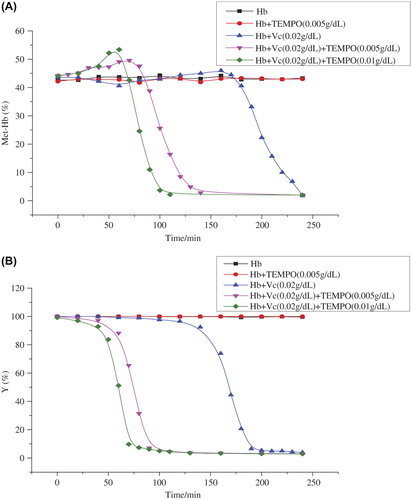
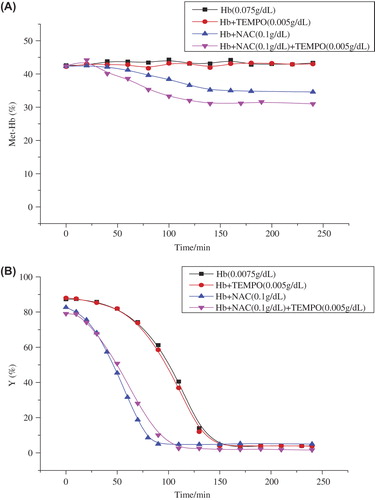
Figure 5. The variation curve of Met-Hb and oxygen saturation in the process of NAC and TEMPO without de-oxygenation. Assay condition as described in .
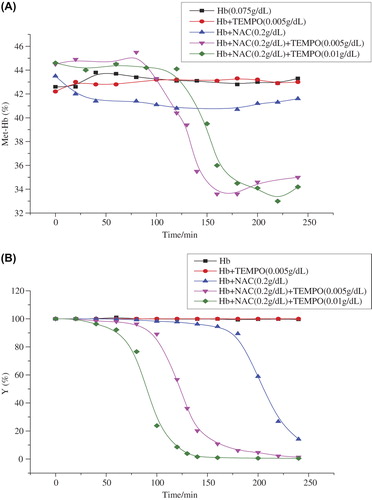
Figure 6. The variation curve of Met-Hb and oxygen saturation in the process of Vc and TEMPO after de-oxygenation. Assay condition: remove oxygen dissolved in Hb solution within 30 min before adding the reductant or the mixture and other conditions are as described in .
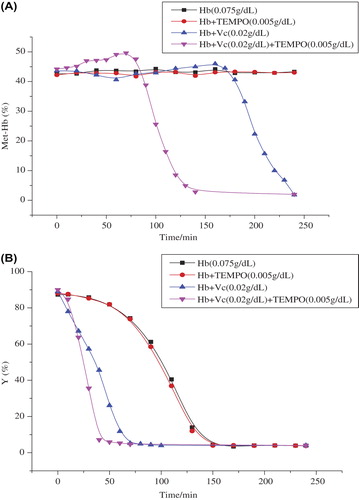
Figure 7. The variation curve of Met-Hb and oxygen saturation in the process of NAC and TEMPO after de-oxygenation. Assay condition as described in .