859
Views
9
CrossRef citations to date
0
Altmetric
Research Article

The liver-targeting study of the N-galactosylated chitosan in vivo and in vitro

, , , , , & show all
Pages 423-428 | Received 09 Jul 2013, Accepted 02 Sep 2013, Published online: 25 Sep 2013

Figures & data

Table I. The values of DS of lactosyl group in GC and the Mw of GC.

Figure 1. The synthetic scheme of GC (Liang et al., Citation2011).
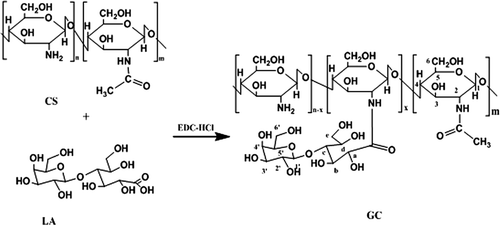
Figure 1. The synthetic scheme of GC (Liang et al., Citation2011).

Figure 2. Tissue distribution of GCH-FITC and CS-FITC in ICR mice at 5 min, 1 h, and 8 h after i.v. administration at a dose of 0.2 mL per mouse. Each point represents the mean ± SD (n = 3).
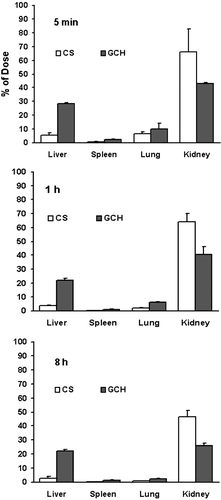
Figure 2. Tissue distribution of GCH-FITC and CS-FITC in ICR mice at 5 min, 1 h, and 8 h after i.v. administration at a dose of 0.2 mL per mouse. Each point represents the mean ± SD (n = 3).

Figure 3. The biodegradability of CS-FITC and GCH-FITC in liver of ICR mice after i.v. at a dose of 0.2 mL per mouse. Each point represents the mean ± SD (n = 3).
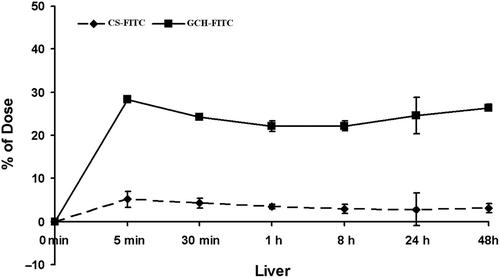
Figure 3. The biodegradability of CS-FITC and GCH-FITC in liver of ICR mice after i.v. at a dose of 0.2 mL per mouse. Each point represents the mean ± SD (n = 3).

Figure 4. ASGPR expression in the human normal liver cell line HL-7702 and hepatoma cell line HepG2 or SMMC-7721 by Western blotting (A). Quantitative analysis of ASGPR expression in different cell lines (B) (mean ± SD, n = 3).
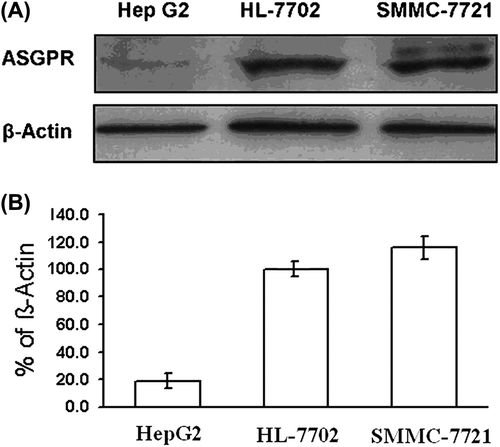
Figure 4. ASGPR expression in the human normal liver cell line HL-7702 and hepatoma cell line HepG2 or SMMC-7721 by Western blotting (A). Quantitative analysis of ASGPR expression in different cell lines (B) (mean ± SD, n = 3).

Figure 5. The proliferation inhibition of CS, GCH, GCM, and GCL on the cells of SMMC-7721 (A), HepG2 (B) determined by MTT assay. (mean ± SD, n = 8). *P < 0.05, **P < 0.01 versus control; P < 0.05,versus CS.

Figure 5. The proliferation inhibition of CS, GCH, GCM, and GCL on the cells of SMMC-7721 (A), HepG2 (B) determined by MTT assay. (mean ± SD, n = 8). *P < 0.05, **P < 0.01 versus control; △P < 0.05,versus CS.
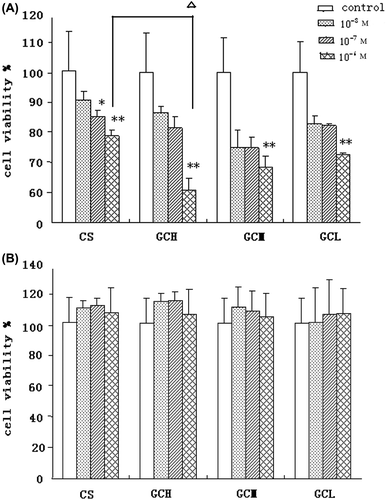
Figure 6. The proliferation inhibition of CS, GCH, GCM, and GCL on the normal liver cell line HL-7702 determined by MTT assay. (mean ± SD, n = 8).
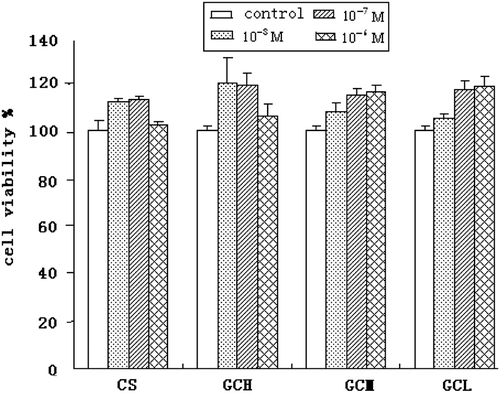
Figure 6. The proliferation inhibition of CS, GCH, GCM, and GCL on the normal liver cell line HL-7702 determined by MTT assay. (mean ± SD, n = 8).

Reprints and Corporate Permissions

Please note: Selecting permissions does not provide access to the full text of the article, please see our help page How do I view content?

To request a reprint or corporate permissions for this article, please click on the relevant link below:

Academic Permissions

Please note: Selecting permissions does not provide access to the full text of the article, please see our help page How do I view content?

Obtain permissions instantly via Rightslink by clicking on the button below:

If you are unable to obtain permissions via Rightslink, please complete and submit this Permissions form. For more information, please visit our Permissions help page.