Figures & data
Figure 4. pPolyHb induces HO-1 expression in a concentration- and time-dependent manner. (A) Cells were treated with 125 μM of pPolyHb for the indicated time (0, 2, 4, 6, 8, 10 h) and HO-1 expression was analyzed by Western blot. (B) Cells were treated for 10 h with the indicated concentrations (0, 125, 50, 25, 5 μM) of pPolyHb or pretreated with SnPP (20 μM) for 2 h, followed by treatment ith 125 μM pPolyHb, and then HO-1 expression was analyzed by Western blot. β-actin was used for normalization. **P < 0.01 compared to the control.
Figure 5. Effects of pPolyHb on phosphorylation of JNK and p38 mitogen-activated protein kinase (MAPK) in H2O2-treated HUVECs. Cells were cultured in 6-well plates until confluent, and the medium was replaced with serum-free medium and cultured in the presence or absence of pPolyHb (5, 25, and 125 μM) for 10 h. Cells were then treated with 400 μM H2O2 for 4 h, followed by lysis and Western blot analysis. Densitometry scanning analysis of p-JNK and p-p38 MAPK phosphorylation was performed. GAPDH was used for normalization. Western blot images are representative of three independent experiments. Data are means ± standard errors (n = 3). ##P < 0.01 compared to the control, **P < 0.01 compared to the group treated with H2O2 alone.
Figure 6. SnPP attenuates the inhibitory effect of pPolyHb against H2O2-induced phosphorylation of JNK and p38 MAPK in HUVECs. Cells were treated with pPolyHb (125 μM), with or without pretreatment with SnPP (20 μM), followed by H2O2 (400 μM) incubation for 4 h. Western blot analysis was performed to determine the phosphorylation and protein expression of JNK and p38 MAPK. Normalization was performed with the anti-GAPDH antibody. Western blot images are representative of three independent experiments. ##P < 0.01 compared to control, **P < 0.01 compared to the group treated with H2O2 alone, $$P < 0.01 compared to the pPolyHb pretreatment group.
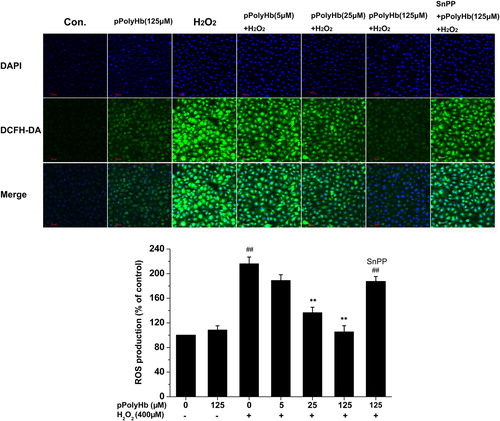
Figure 7. Effects of pretreatment with pPolyHb on intracellular generation of reactive oxygen species (ROS). After 10 h of pretreatment with or without pPolyHb (5, 25, and 125 μM) or pretreatment with SnPP (10 μM) and pPolyHb (125 μM), HUVECs were exposed to H2O2 (400 μM) for 4 h. (A) Confocal microscopy images of cells fluorescently stained with DCFH-DA (magnification, × 40, scale bar = 50 μm). The microscopy images are representative of three independent experiments. (B) ROS generation was assayed using DCFH-DA fluorescence measured with a fluorometer (excitation = 485 nm, emission = 535 nm). Data are means ± standard errors (n = 3). ##P < 0.01 compared to the control; **P < 0.01 compared to the group treated with H2O2 alone.