Figures & data
Figure 1. Viability of CB MSCs. The effect of incorporation of 10, 100, and 500 μg/ml fibronectin on (A) % viability of the encapsulated cells and (B) viable cells (% control). Data are means ± SD, n = 4, Student's t-test. *Significant difference of 100 μg/ml fibronectin and 500 μg/ml fibronectin from control, **Significant difference of 100 μg/ml fibronectin and 500 μg/ml fibronectin from 10 μg/ml fibronectin, P < 0.05.
Figure 2. Proliferation of CB MSCs. (A) The effect of fibronectin-alginate microcapsules on viability of encapsulated cells. (B) Comparison of total number of cells in fibronectin-alginate microcapsules. Cell proliferation was calculated using the LIVE/DEAD viability assay. Data are means ± SD, n = 4, Student's t-test. *Significant difference of 100 μg/ml fibronectin and 500 μg/ml fibronectin from control, **Significant difference of 100 μg/ml fibronectin and 500 μg/ml fibronectin from 10 μg/ml fibronectin, P < 0.05.
Figure 3. FIX secretion by CB MSC. Comparison of FIX secretion from MSCs in non-supplemented (control), and fibronectin-supplemented microcapsules (10 μg/ml, 100 μg/ml, 500 μg/ml fibronectin). FIX secretion was measured using ELISA assay and reported as (A) the amount of FIX (ng) secreted from 1 ml of microcapsules in 24 h. (B) The amount of FIX secretion from fibronectin-alginate microcapsules/the amount of FIX secretion from control microcapsules. Data are means ± SD, n = 4. P < 0.05, Student's t-test. *Significant difference of 100 μg/ml fibronectin and 500 μg/ml fibronectin from control, **Significant difference of 100 μg/ml fibronectin and 500 μg/ml fibronectin from 10 μg/ml fibronectin, P < 0.05.
Figure 4. FIX secretion index (ng FIX secreted from 106 viable cells/24 h) of fibronectin-alginate and non-supplemented alginate microcapsules during one-month in vitro culture. Data are means ± SD, n = 4. P < 0.05, Student's t-test. *Significant difference from control.
Figure 5. Transmission electron microscopy images of CB MSCs encapsulated in control microcapsules (A, B); 10 μg/ml fibronectin microcapsules (C, D); 100 μg/ml fibronectin microcapsules (E, F); 500 μg/ml fibronectin microcapsules (G, H). Cells were fixed 10 days after encapsulation and processed for electron microscopy. Bars indicate 2 microns.
Figure 6. Viability and FIX secretion of CB MSCs in differentiation media. (A) Number of viable MSC in 100 μg/ml fibronectin microcapsules cultured in differentiation media normalized to the number of viable cells grown in basal media. (B) Comparison of FIX secretion from the MSCs in 100 μg/ml fibronectin microcapsules grown in differentiation media. Data are means ± SD, n ≥ 3. Viable cells were measured calculated using the LIVE/DEAD viability assay. FIX secretion was measured using ELISA. P < 0.05, Student's t-test. *Significant difference from 100%.
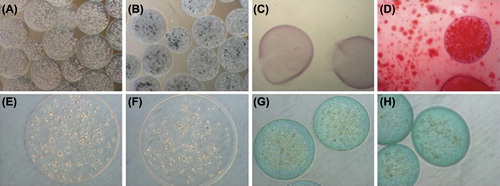
Figure 7. Differentiation potential of microencapsulated FIX-engineered CB MSCs. (A–D) Osteogenic differentiation analysis, (A) unstained in basal medium, (B) unstained in osteogenic medium, stained with Alizarin Red in basal (C) and osteogenic medium (D); (E, F) Adipogenic differentiation analysis, stained with Oil Red-O in basal (E) and adipogenic medium (F); (G, H) Chondrogenic differentiation analysis, stained with Alcian Blue in basal (G) and chondrogenic medium (H).