762
Views
0
CrossRef citations to date
0
Altmetric
Original Articles

Preparation and characterization of PEG-modified PCL nanoparticles for oxygen carrier: a new application of Fourier transform infrared spectroscopy for quantitative analysis of the hemoglobin in nanoparticles

, &
Pages 345-354 | Received 02 Dec 2013, Accepted 21 Jan 2014, Published online: 12 Mar 2014

Figures & data

Table I. The five ratio-points of calibration standards weighed carefully for the four linear regression curves.a,b,c

Table II. The actual weights of nanoparticles and PAN of each sample with the ratio be around 1:4.

Figure 1. TEM image of mPEG-PCL with PEG mole ratio of 30% (HbPN30) revealing shape and sizes of nanoparticles encapsulating hemoglobin molecules.

Table III. Particles size and surface charge of hemoglobin-loaded polymeric nanoparticles encapsulated by four types of polymer.

Figure 2. FTIR spectra of PAN, Hb and the polymers used as nanoparticles shells. (a) The special absorbance peaks in FTIR were (1) the bending vibration of N–H (amide II) at 1540 cm−1 attributed to Hb and (2) the stretching vibration of –C≡N at 2241 cm−1 attributed to PAN, respectively; (b) the bands (1) Hb and (2) PAN used in this quantification method had no interference signals with the polymers used in experiments.
Figure 3. Infrared spectra of Span-80 and Tween-80 comparing to blank nanoparticles encapsulated by Span-80 and Tween-80. There were no interference peak from Span-80 and Tween-80 at PAN special absorbance peaks 2241 cm−1. Furthermore, note that the disappearance of the Span-80 absorbance peak at Hb special absorbance peaks 1560 cm−1 after nanoparticles formed which could verify the specificity of this promoted method.
Figure 4. Regression lines of polymeric Hb-BPN-PAN between the hamide II/hPAN ratio (y) and the weight ratio of Hb to PAN (x). The diblock polymeric nanoparticles were fabricated by PCL, mPEG-PCL with PEG mole fraction of 10% and mPEG-PCL with PEG mole fraction of 30% in the identical preparation process.

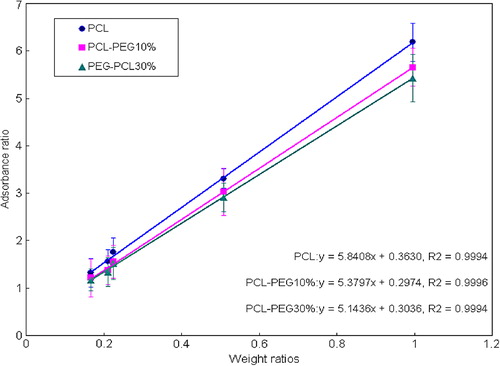
Table IV. Accuracy (percent recovery) of the method for the determination of Hb content in Hb-BPN mixture (n = 5).

Table V. The intra- and inter-day precision (relative standard deviation) of the method for the determination of Hb content in Hb-BPN mixture (percent of drug loading).

Figure 5. Drug loading and relative standard deviation in HbPN. The samples HbPN0 was prepared by PCL. The samples HbPN10 to HbPN30 were prepared by copolymer mPEG-PCL and the PEG percentage in copolymer were 10 and 30%.
Figure 6. Schematic representation of the relationship between some Hb liquid droplet and low or high density. PEG brush structure on the surface of nanoparticles. (a) The PEG chains with low density would form entrance for hemoglobin being incorporated into inner water phase during the formation of HbPN. (b) When more density of PEG segments was surrounding the nanoparticles, the stronger steric repulsion was produced to prevent not only from opsonins adsorption but Hb encapsulated into inner phase.

Reprints and Corporate Permissions

Please note: Selecting permissions does not provide access to the full text of the article, please see our help page How do I view content?

To request a reprint or corporate permissions for this article, please click on the relevant link below:

Academic Permissions

Please note: Selecting permissions does not provide access to the full text of the article, please see our help page How do I view content?

Obtain permissions instantly via Rightslink by clicking on the button below:

If you are unable to obtain permissions via Rightslink, please complete and submit this Permissions form. For more information, please visit our Permissions help page.