Figures & data
Table I. Layout of design actual.
![Figure 1. In-vitro release pattern: (a) In-vitro diffusion graph of pure LXM and Fopt; (b) In-vitro dissolution graph of pure LXM and Fopt.](/cms/asset/46c8c2fe-2d8f-4fad-ad84-5c87d1887872/ianb_a_898646_f0001_oc.jpg)
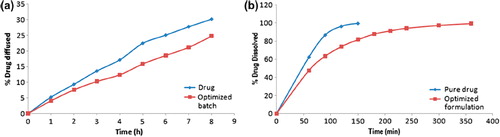
Table II. Composition of factorial batches using 32 full factorial design.
![Figure 2. (a) Contour plot showing effect of deposition temperature and number of bilayer coating on percentage drug release; (b) Surface response curve showing effect of deposition temperature and number of bilayer coating on percentage drug release.](/cms/asset/937ac6b9-a379-408f-af58-abb4c5ef31d4/ianb_a_898646_f0002_oc.jpg)
![Figure 3. (a) Contour plot of percentage drug loading; (b) Surface response curve of percentage drug loading with respect to deposition temperature and number of bilayer coating.](/cms/asset/95a85374-d5a2-4bc7-86b2-0519204f9669/ianb_a_898646_f0003_oc.jpg)
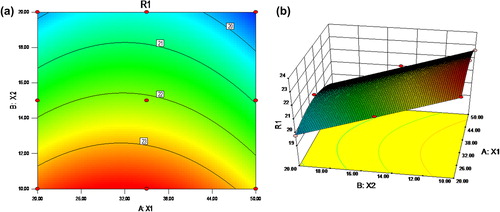
Table III. The ANOVA for percentage drug diffusion at 8 h.
Table IV. The ANOVA for percentage drug loading.
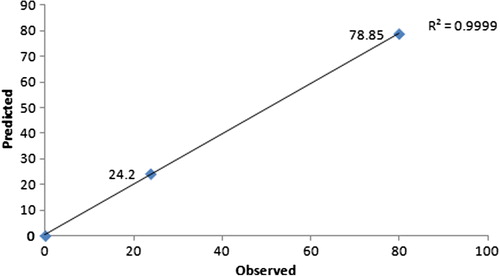
Table V. Predicted and observed value of response of Fopt and prediction error.
![Figure 9. SEM of (a) pure nanocrystaline LXM particles (b) LbL-encapsulated LXM nanocrystaline particles.](/cms/asset/e3b3fd19-aee0-452f-a270-b4f744a36eda/ianb_a_898646_f0009_b.gif)