1,436
Views
21
CrossRef citations to date
0
Altmetric
ORIGINAL ARTICLE

Triamcinolone acetonide–Eudragit® RS100 nanofibers and nanobeads: Morphological and physicochemical characterization

, , , , , & show all
Pages 362-369 | Received 09 Jul 2014, Accepted 06 Aug 2014, Published online: 02 Sep 2014

Figures & data

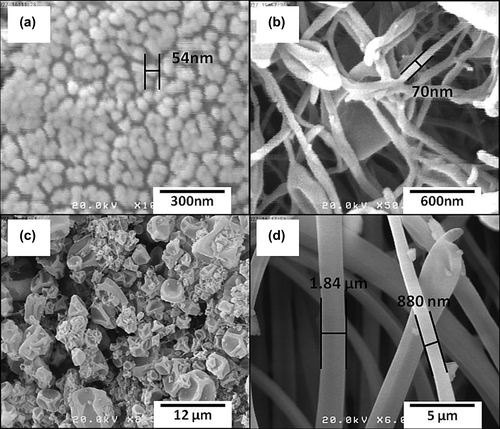
Figure 1. SEM images for TA-Eudragit® RS100 electrosprayed samples (a) and (b): samples with the drug: polymer ratio of 1:5 and solution concentrations of 10% (a) and 20% (b). (c) and (d): samples with the drug: polymer ratio of 1:10 and solution concentrations of 10% (c) and 20% (d).
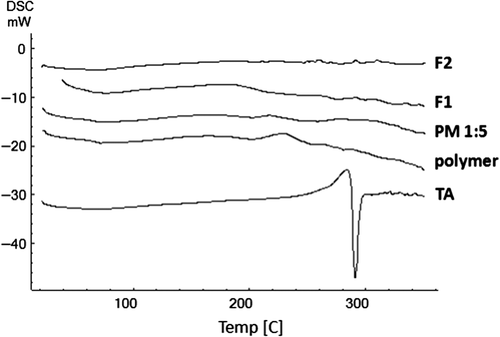
Figure 2. DSC thermograms of TA; Eudragit® RS100; PM 1:5 (physical mixture with the drug: polymer ratio of 1:5) and formulations with the drug: polymer ratio of 1:5 prepared using 10% (F1) and 20% (F2) solution concentrations.
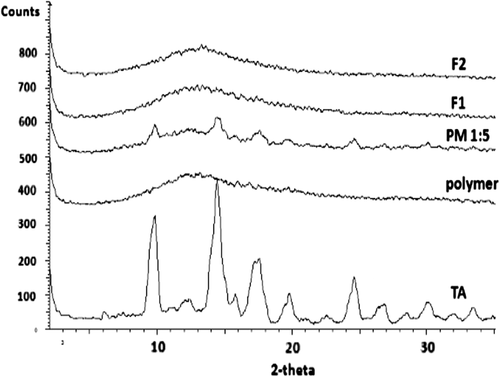
Figure 3. X-Ray diffractograms of TA; Eudragit® RS100; PM 1:5 (physical mixture with the drug: polymer ratio of 1:5); and formulations with the drug: polymer ratio of 1:5 prepared using 10% (F1) and 20% (F2) solution concentrations.
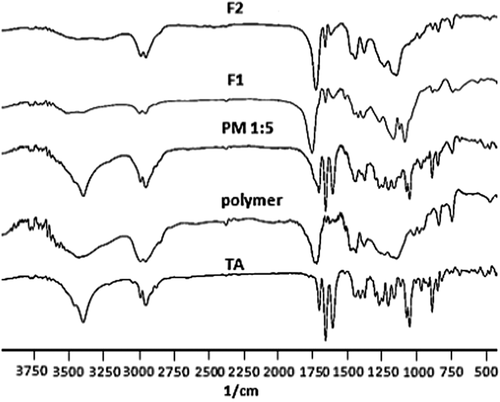
Figure 4. FT-IR spectra of TA; Eudragit® RS100; PM 1:5 (physical mixture with the drug: polymer ratio of 1:5); and formulations with the drug: polymer ratio of 1:5 prepared using 10% (F1) and 20% (F2) solution concentrations.
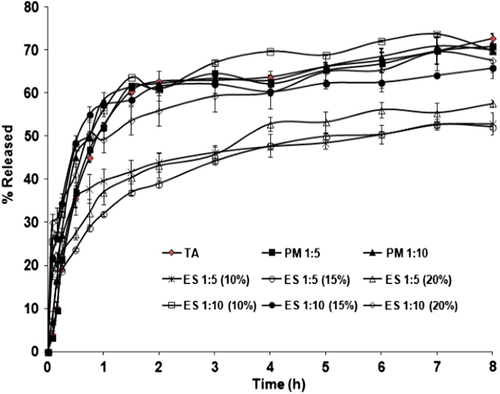
Figure 5. Drug release profiles for the pure drug (TA); physical mixtures (PM) and the prepared electrosprayed samples (ES). The values 1:5 and 1:10 indicate drug: polymer ratio. The values of 10%, 15% and 20% represent the total solution concentrations.

Table I. Model-independent parameters of the different samples.

Table II. Parameters of the different kinetic models; squared correlation coefficients (RSQ); and percent error (PE) for the formulations F1–F6.

Reprints and Corporate Permissions

Please note: Selecting permissions does not provide access to the full text of the article, please see our help page How do I view content?

To request a reprint or corporate permissions for this article, please click on the relevant link below:

Academic Permissions

Please note: Selecting permissions does not provide access to the full text of the article, please see our help page How do I view content?

Obtain permissions instantly via Rightslink by clicking on the button below:

If you are unable to obtain permissions via Rightslink, please complete and submit this Permissions form. For more information, please visit our Permissions help page.