Figures & data
Figure 1. Tumor cell morphology in different culture models. Typical morphology of cells grown in 2-D substrata (left) at day-2 vs. cells grown in the 3-D culture model (middle, 20×; right, 40×). The 95-D (A), U87 (B) and HCT116 (C) grown for 9 days in the collagen scaffold in the same conditions. Phase-contrast images were obtained at day-7 using an inverted microscope. Scale bar = 100 μm.
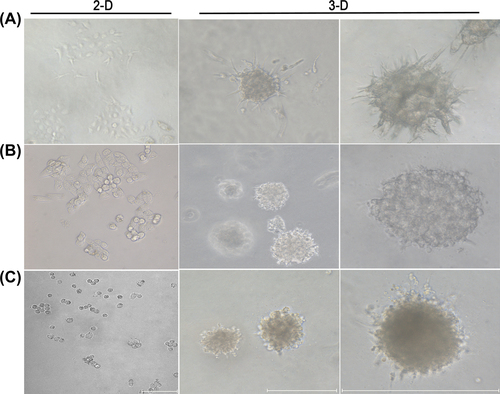
Figure 2. Morphological appearance of 95-D tumor cells cultured on the collagen gel with different seeding densities. Cultures maintained for 9 days and images captured every 3 days using light microscopy. Scale bar = 100 μm.
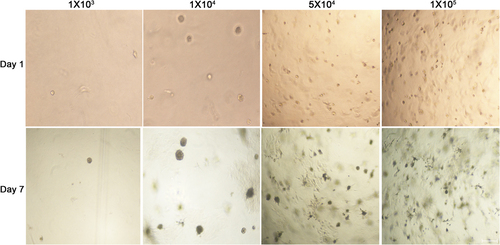
Figure 3. Image of HCT116 cell spheroids stained with Propidium Iodide nuclear labeling dye. (A) Monolayer cells; (B) The organization of granule cell layer in multicellular spheroids; (C) The complete 3-D cells (nuclei) in 3-D image. All pictures were taken using confocal laser scanning microscopy.
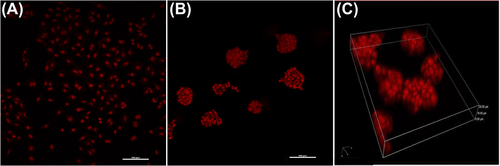
Figure 4. Cytotoxicity of 95-D cells induced by 5-FU formulations. (A) Growth inhibition of 5-FU or 5-FU/PM of tumor cells in different models was measured by MTT assay. Cells were incubated in 2-D model for 2 days or in 3-D for 5 days and then treated with 50 μg/mL 5-FU equivalent concentration of 5-FU/PM for 48 h. (B) Morphology of cells after exposure to 5-FU-loaded micelles for 48 h. Bright field images were captured using an inverted microscope to monitor morphology of cells in the control group (left) and treated group (right). Data from three independent experiments were presented as mean ± SD, and the Student's t-test was used to compare the means of two samples, ns: no significance; **p < 0.01; ***p < 0.001. Scale bar = 100 μm.
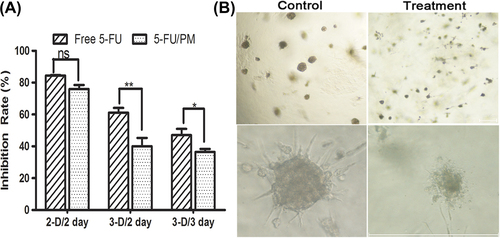
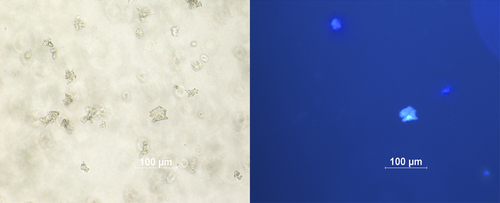
Figure 5. Fluorescence microscopy images of multicellular spheroids HCT116 cells incubated with coumarin-polymer micelles for 4 h. Left image is bright field and right is the fluorescence image.