Figures & data
Table I. Independent variables along with their coded level, actual level, and respective response values of different batches of quercetin-loaded liposomes.
Table II. Summary of results of regression analysis of responses and analysis of variance for drug release, particle size, and EE.
Table III. Comparison of the observed and predicted values for the liposomes prepared under predicted optimum conditions.
Figure 1. Surface plots showing the effect of variables on (A) particle size, and (B) % Entrapment Efficiency, and (C) % Drug Loading.
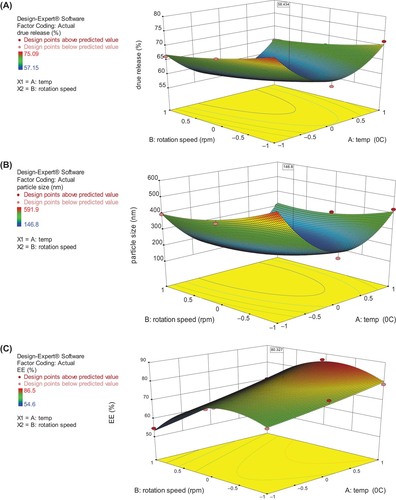
Figure 2. DSC thermograms of quercetin, cholesterol and physical mixture.
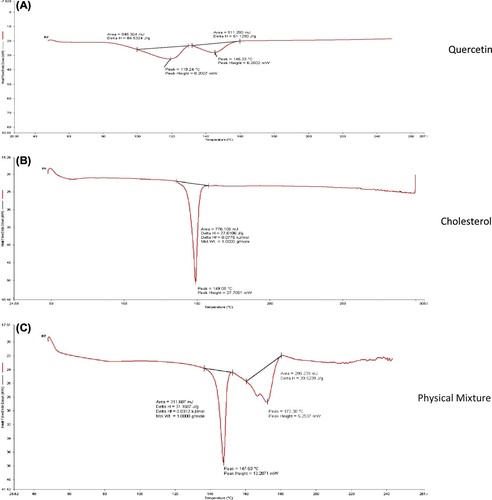
Figure 3. TEM image of optimized quercetin-loaded liposome.
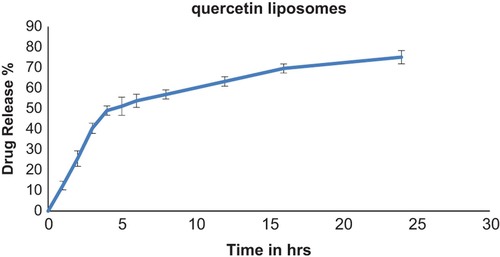
Figure 4. Release profile of the optimized quercetin-loaded liposome in phosphate buffer of pH 7.4, at 37°C.