
Figures & data
Figure 1. TEM image of TiO2-NPs.
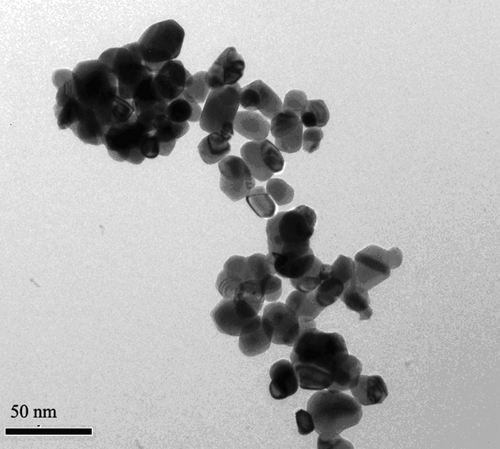
Table I. Average aggregation size and zeta potential in a solution of TiO2–NPs.
Figure 2. The result of western blotting, showing the effect of TiO2-NPs on α-Syn expression in PC12 cells.
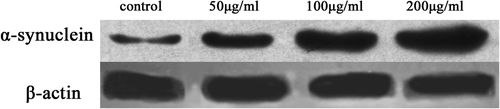
Figure 3. The result of western blotting, showing the α-Syn expression in PC12 cells after treatment with TiO2-NPs and NAC.
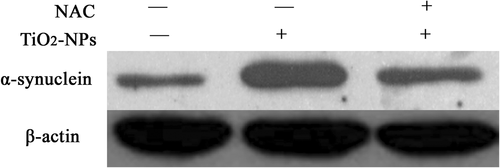
Table II. The result of western blotting, showing the effect of TiO2-NPs on α-Syn in PC12 cells (grey value, %).
Figure 4. The result of immunofluorescent staining, showing the effect of TiO2-NPs on α-Syn aggregation in PC12 cells.
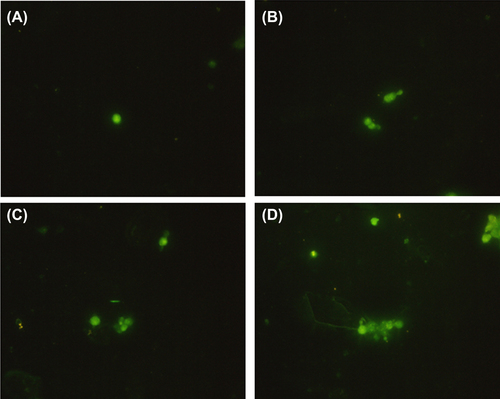
Figure 5. The result of western blotting, showing the expression of parkin and UCH-L1 after treatment with TiO2-NPs.
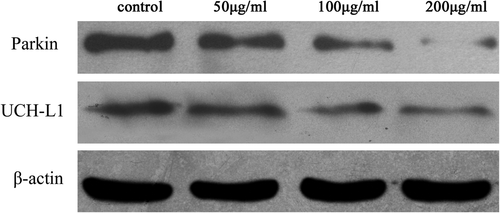
Table III. Parkin and UCH-L1 expression levels after TiO2-NPs treatment in PC12 cells (grey value, %).