Figures & data
Table I. Forward (F) and reverse (R) primer sequences, and product size base pairs (bp) of the Housekeeping genes β-actin and telomerase.
Figure 1. FT-IR spectra of PLGA-PEG copolymer nanoparticles.
Table II. FT-IR bands of PLGA-PEG copolymer.
Figure 2. 1H NMR spectrum of the PEG-PLGA copolymer.
Figure 3. The SEM nanographs of helenalin-loaded PLGA–PEG copolymer nanoparticles (A) PLGA-PEG-helenalin (B) PLGA-PEG.
Table III. The values of encapsulation efficiency achieved for helenalin and the presence of PEG- PLGA with different molecular weights.
Figure 4. (A) The comparison of the cytotoxic effect of free helenalin (left) and NC-helenalin (right) on T47D cells over a 24-h exposure. This graph shows that both free helenalin and NC-helenalin have not IC50 in the 24-h exposure on T47D cells, within the concentration limits. (B) The comparison of the cytotoxic effect of free helenalin (left) and NC-helenalin (right) on T47D cells over a 48-h exposure. This graph shows that free helenalin has no IC50 in the 48 h exposure for T47D cells within the concentration limits, but NC-helenalin has IC50 in 48 h (0.16 μM). (C) A comparison of the cytotoxic effect of free helenalin (left) and NC-helenalin (right) on T47D cells over a 72-h exposure. This graph shows that the IC50 of free helenalin is about 1.3 μM and that of NC-helenalin is about 0.14 μM, over a 72-h exposure for T47D cells.
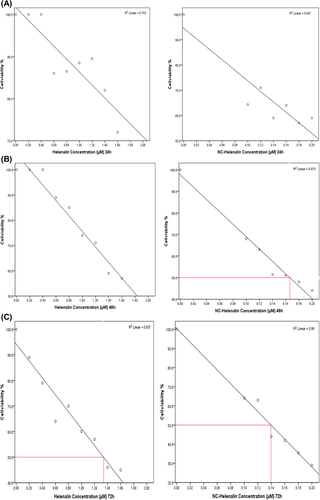
Figure 5. (A) Amplification column for hTERT expression in free helenalin. (B) Amplification column for hTERT expression in NC− helenalin.