
Figures & data
Figure 1. FT-IR diagram of the Structure of (A) NIPAAm-MAA copolymer (B) curcumin-loaded NIPAA-MAA.
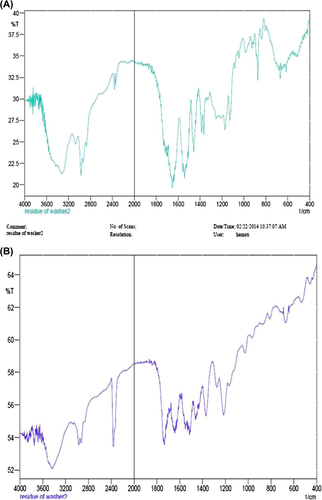
Figure 2. 1H NMR spectrum of the NIPAAm-MAA co-polymer.
Figure 3. Scanning electron microscopy: (A) NIPAAm-MAA co-polymer (B) Curcumin-loaded NIPAAm-MAA.
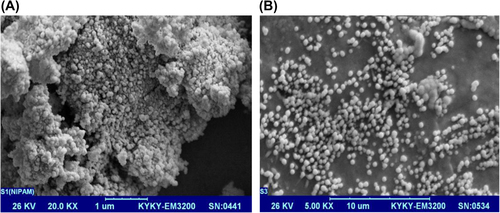
Figure 4. Curcumin release from the nanoparticles at different pH levels and temperatures.
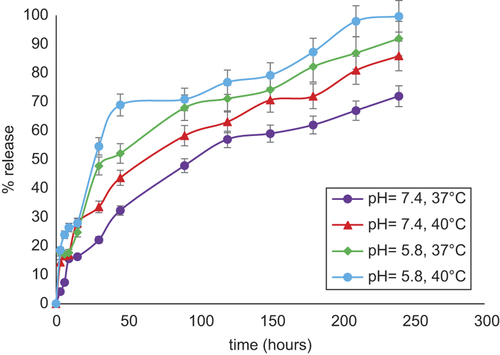
Figure 5. (A) 24-h MTT assay results. The cytotoxic effects of different concentrations of free curcumin and curcumin-loaded NIPAAm-MAA on the MCF-7 cell line. (B) 48-h MTT assay results. (C) 72-h MTT assay results. (D) The cytotoxic effects of curcumin-loaded NIPAAm-MAA nanoparticles on the MCF-7 cell line at different times. Analysis of the MTT assay results showed a time-dependent decrease in the viability of MCF-7 for curcumin-loaded NIPAAm-MAA nanoparticles.
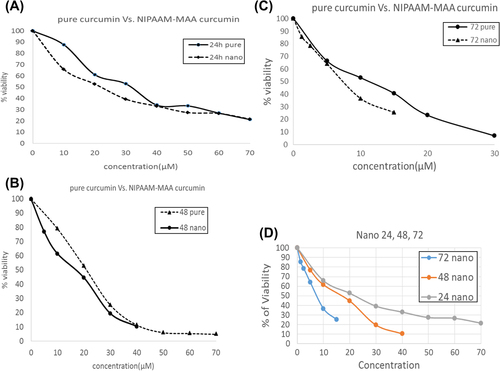
Table I. IC50 values of curcumin and curcumin-loaded NIPAAm-MAA at different times of incubation.