3,265
Views
26
CrossRef citations to date
0
Altmetric
ORIGINAL ARTICLE

Comparison, synthesis and evaluation of anticancer drug-loaded polymeric nanoparticles on breast cancer cell lines

, , , , , , & show all
Pages 1008-1017 | Received 03 Dec 2014, Accepted 06 Jan 2015, Published online: 24 Feb 2015

Figures & data

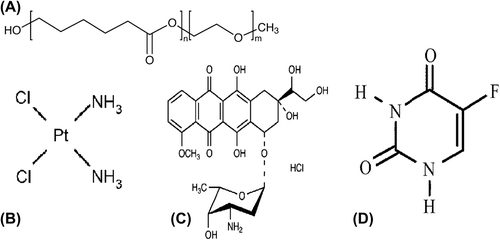
Figure 1. Chemical structure of (A) PCL-PEG, (B) Cisplatin, (C) Doxorubicin, and (D) 5-Fluorouracil.
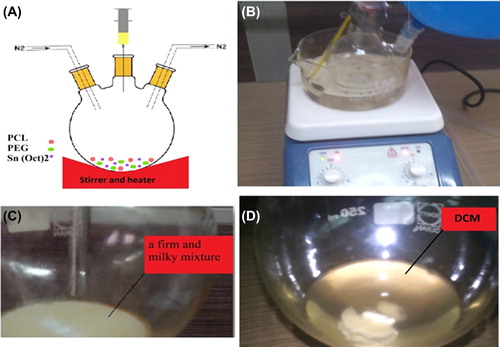
Figure 2. (A) Schematic structure of three-necked flask under stirrer and heater device, (B) three-necked flask under stirrer and heater device in our laboratory, (C) a firm and milky mixture of polymer, and (D) dissolving polymer in DCM (dichloromethane).
Figure 3. Preparation of encapsulated drugs. The drugs were loaded in nanoparticles with a combination of different techniques, which are known as w/o/w or water-in-oil-in-water (double emulsion). (A) Water [W], (B) Oil [O], (C) W/O emulsion, (D) W/O/W emulsion, and (E) Schematic structure of encapsulated drugs.
Figure 4. Synthesis of poly (ε-caprolactone)-poly (ethylene glycol)-poly (ε-caprolactone).
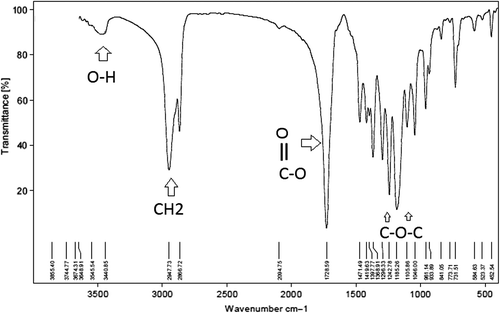
Figure 5. Fourier transform infrared spectra (FTIR) of poly (ε-caprolactone)-poly (ethylene glycol)-poly (ε-caprolactone).
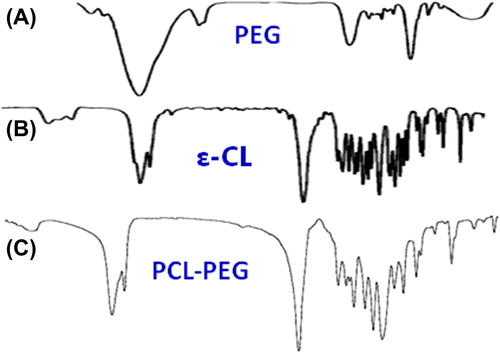
Figure 6. Comparison of FTIR of poly (ethylene glycol) (A), ε-caprolactone (B), and poly (ε-caprolactone)-poly (ethylene glycol)-poly (ε-caprolactone) (C).
Figure 7. 1HNMR spectrum of poly(ε-caprolactone)-poly(ethylene glycol)-poly(ε-caprolactone).
Figure 8. Cytotoxic effect of free and encapsulated 5-Fluorouracil on T47D over a 24-h exposure.
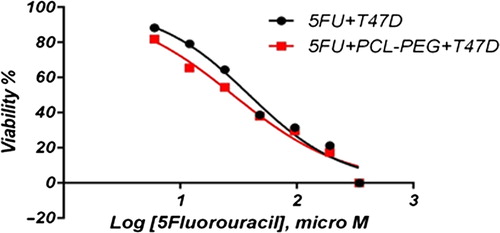
Figure 9. Normalized MTT assay data for free and encapsulated 5-flourouracil on T47D over a 24-h exposure.
Figure 10. Cytotoxic effect of free and encapsulated 5-flourouracil on MCF7 over 24-h exposure.
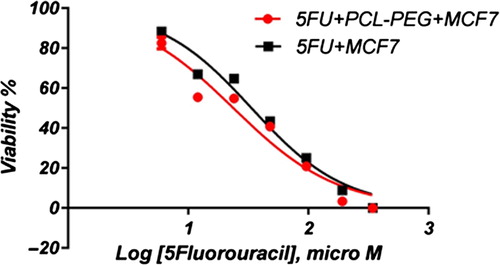
Figure 11. Normalized MTT assay data for free and encapsulated 5-flourouracil on MCF7 for 24-h exposure.
Figure 12. Cytotoxic effect of free and encapsulated cisplatin on T47D over a 24-h exposure.
Figure 13. Normalized MTT assay data for free and encapsulated cisplatin on T47D for 24-h Exposure.
Figure 14. Cytotoxic effect of free and encapsulated cisplatin on MCF7 over a 24-h exposure.
Figure 15. Normalized MTT assay data for free and encapsulated cisplatin on MCF7 for 24-h exposure.
Figure 16. Cytotoxic effect of free and encapsulated doxorubicin on T47D over a 24-h exposure.
Figure 17. Normalized MTT assay data for free and encapsulated doxorubicin on T47D for 24-h exposure.
Figure 18. Cytotoxic effect of free and encapsulated doxorubicin on MCF7 over a 24-h exposure.
Figure 19. Normalized MTT assay data for free and encapsulated doxorubicin on MCF7 for 24-h exposure.

Reprints and Corporate Permissions

Please note: Selecting permissions does not provide access to the full text of the article, please see our help page How do I view content?

To request a reprint or corporate permissions for this article, please click on the relevant link below:

Academic Permissions

Please note: Selecting permissions does not provide access to the full text of the article, please see our help page How do I view content?

Obtain permissions instantly via Rightslink by clicking on the button below:

If you are unable to obtain permissions via Rightslink, please complete and submit this Permissions form. For more information, please visit our Permissions help page.